Air Quality Rankings
Air Quality Rankings compares PM2.5 across monitored African countries and cities. It has a live view for recent conditions and a historical view for year-by-year comparison.
Open Rankings
- Sign in to AirQo Nexus.
- Open the global sidebar.
- Select Air Quality Rankings.
Individual URL: https://nexus.airqo.net/user/air-quality/rankings
Organization members can open the organization version from the same global menu.
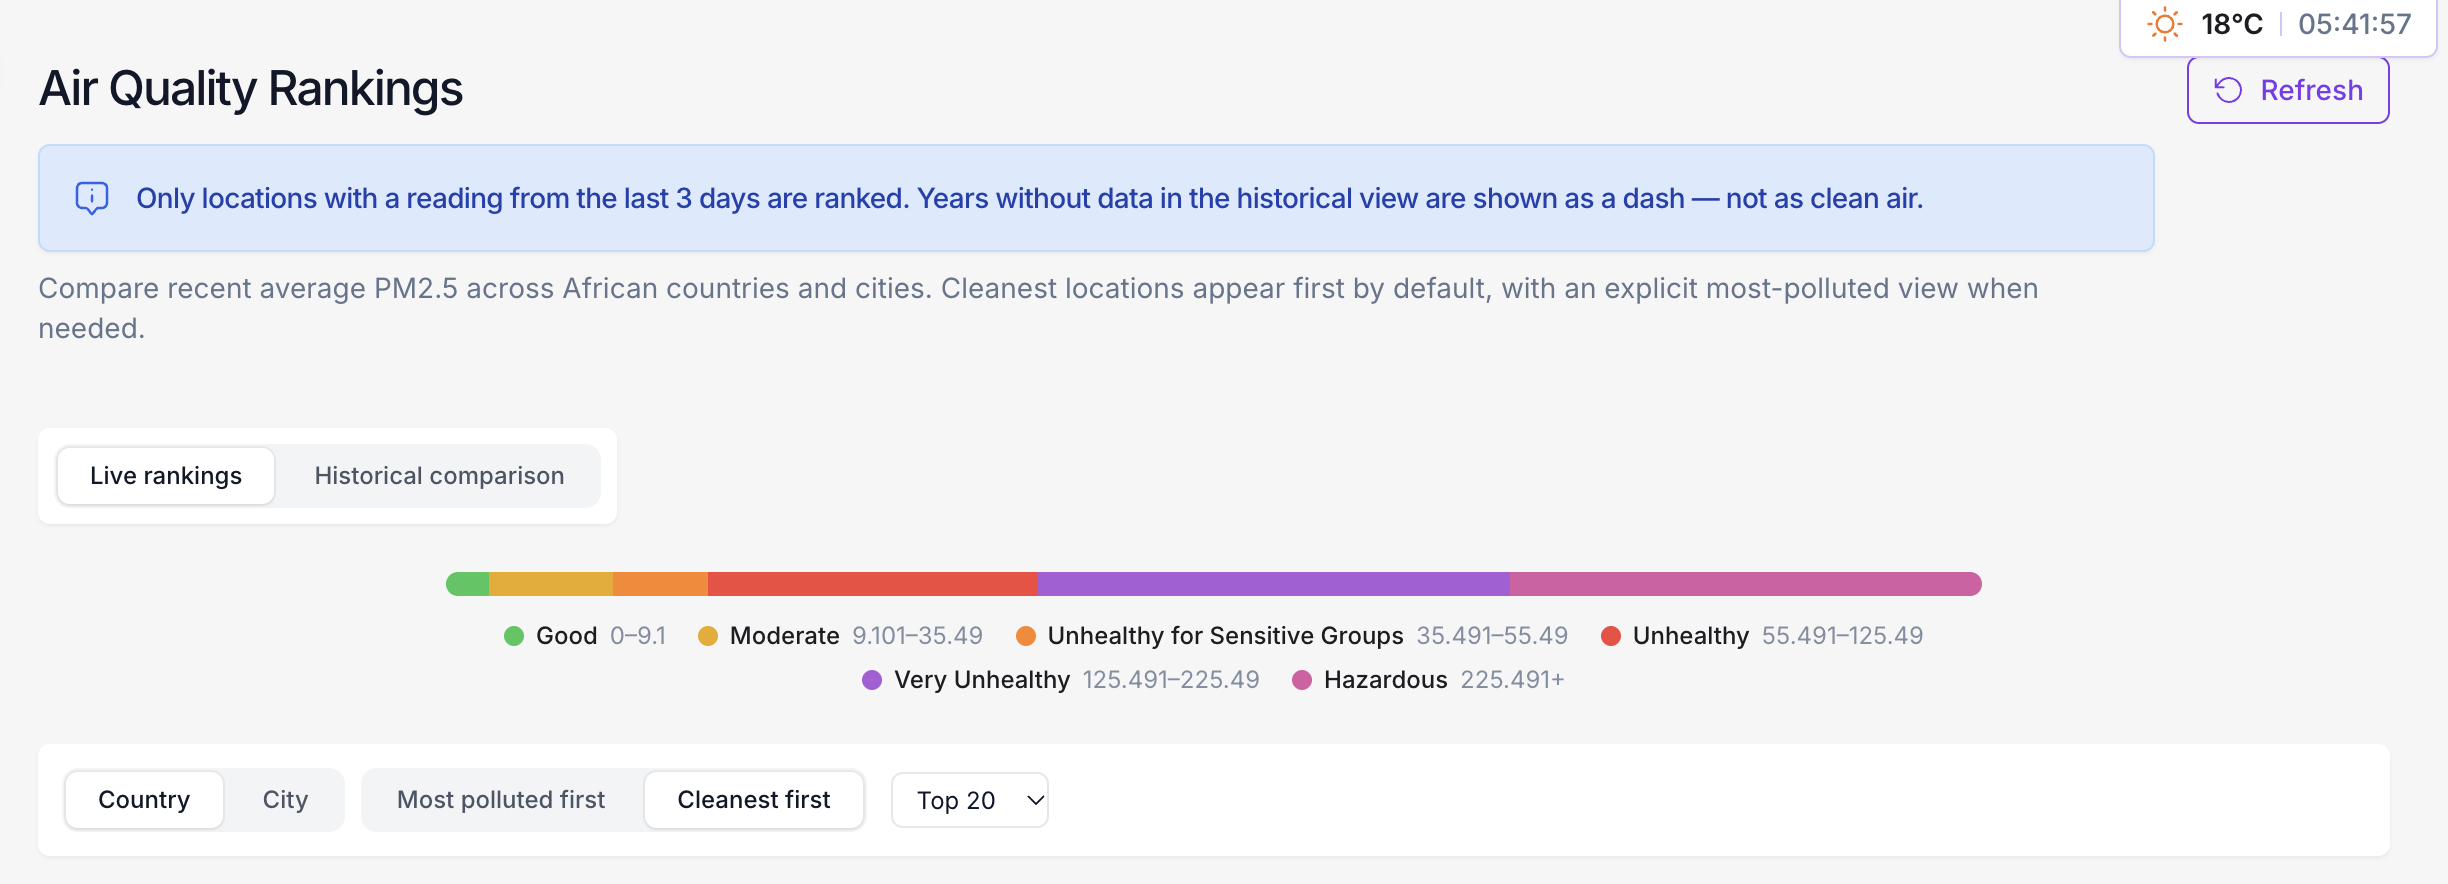
Live rankings
The live view answers: which monitored countries or cities currently have the lowest or highest recent average PM2.5?
Use these controls:
- Country / City: Choose the level of the ranking.
- Cleanest first / Most polluted first: Change the sort direction. Cleanest first is the default.
- Top 10, 20, 50, or 100: Choose how many locations to show.
- Country: When ranking cities, limit the results to one country or leave the filter at all countries.
- Search: Filter the displayed table by location name.
- Refresh: Request the latest available ranking data.
Only locations with a valid reading from the last three days are included. The summary cards show the cleanest and most polluted locations in the current result. The table includes rank, location, average PM2.5, AQI, category, and the number of contributing sites.
The live ranking is a snapshot of monitored locations. A missing country or city means that it is not eligible for the current view; it does not mean the place has clean air.
Historical comparison
The historical view answers: how did monitored countries or cities compare across selected calendar years?
- Select Country or City.
- Choose a start year and end year. The page limits a request to five years.
- When comparing cities, optionally choose a country.
- Review the annual trend chart and year-by-year table.
Annual values summarize the available PM2.5 readings for each location and year. A dash means that no data is available for that location and year; it is not a zero and does not mean clean air. Some city histories begin later than country histories, and Nexus displays a notice when that applies.
The current calendar year is a year-to-date value and can change as new readings arrive.
How to interpret the rankings
- They describe monitored areas: The result reflects the locations and sites that report to AirQo, not every part of a country or city.
- Coverage differs: Use the Sites column to understand how many sites support each live result.
- Coverage matters: Treat the result as a comparison of available monitoring data, not a population-weighted exposure estimate.
- Live rankings can move: New readings, missing readings, and changes in site coverage can change the order.
- AQI is a communication aid: Use the AQI category shown by Nexus for quick interpretation, but use the underlying measurements for research or exposure assessment.
For research, policy analysis, or exposure work, document the selected locations, period, pollutant, aggregation method, and data coverage. See the Researchers Guide.
Frequently asked questions
Why is my location not listed? It may have no AirQo monitoring sites, or no valid PM2.5 reading in the last three days.
Why did a live rank change? The ranking reflects recent site readings and eligible site coverage. Refresh the page to request current data.
Why is historical data shown as a dash? No data is available for that location and year. The dash is not a zero.
Which pollutant is ranked? PM2.5.
Related guides
- Air Quality Levels - understand categories and colors
- Interactive Map - inspect individual monitoring sites
- Air Quality Analysis - build location-specific charts
- Export Air Quality Data - download underlying measurements