Export Air Quality Data
Use Visualization & Data Export to select AirQo monitoring locations, configure the data you need, review the result, and download it as CSV, Excel, PDF, or JSON.
Important: finer-than-hourly data
The Nexus export workflow is not the supported path for finer-than-hourly
sensor downloads. If you need a resolution finer than hourly, including raw or
minute-level readings, use the direct raw-data API endpoint instead.
The Nexus Raw data type or Raw frequency option does not replace the direct API workflow for sub-hourly readings. The API raw-data response is uncalibrated and requires a secret API token plus a Standard Tier subscription or above.
Before you begin
- Sign in: You must be authenticated in Nexus.
- Permission: In an organization workspace, your role must include Data Export. If the permission is missing, the Review & Download action may not appear.
- Data availability: If the selected locations have no readings for the requested filters, Nexus can still download location metadata. A metadata-only file uses a
-metadatasuffix. - Supported formats: The sidebar starts with CSV or JSON. CSV continues to a format picker for CSV, Excel, or PDF; JSON downloads directly.
Open the export page
- Sign in to AirQo Nexus.
- Open the workspace sidebar.
- Select Visualization & Data Export.
| Workspace | URL |
|---|---|
| Individual | https://nexus.airqo.net/user/data-export |
| Organization | https://nexus.airqo.net/org/<your-org>/data-export |
Organization workspaces show Sites and Devices. Individual workspaces also show Countries and Cities.
The page at a glance
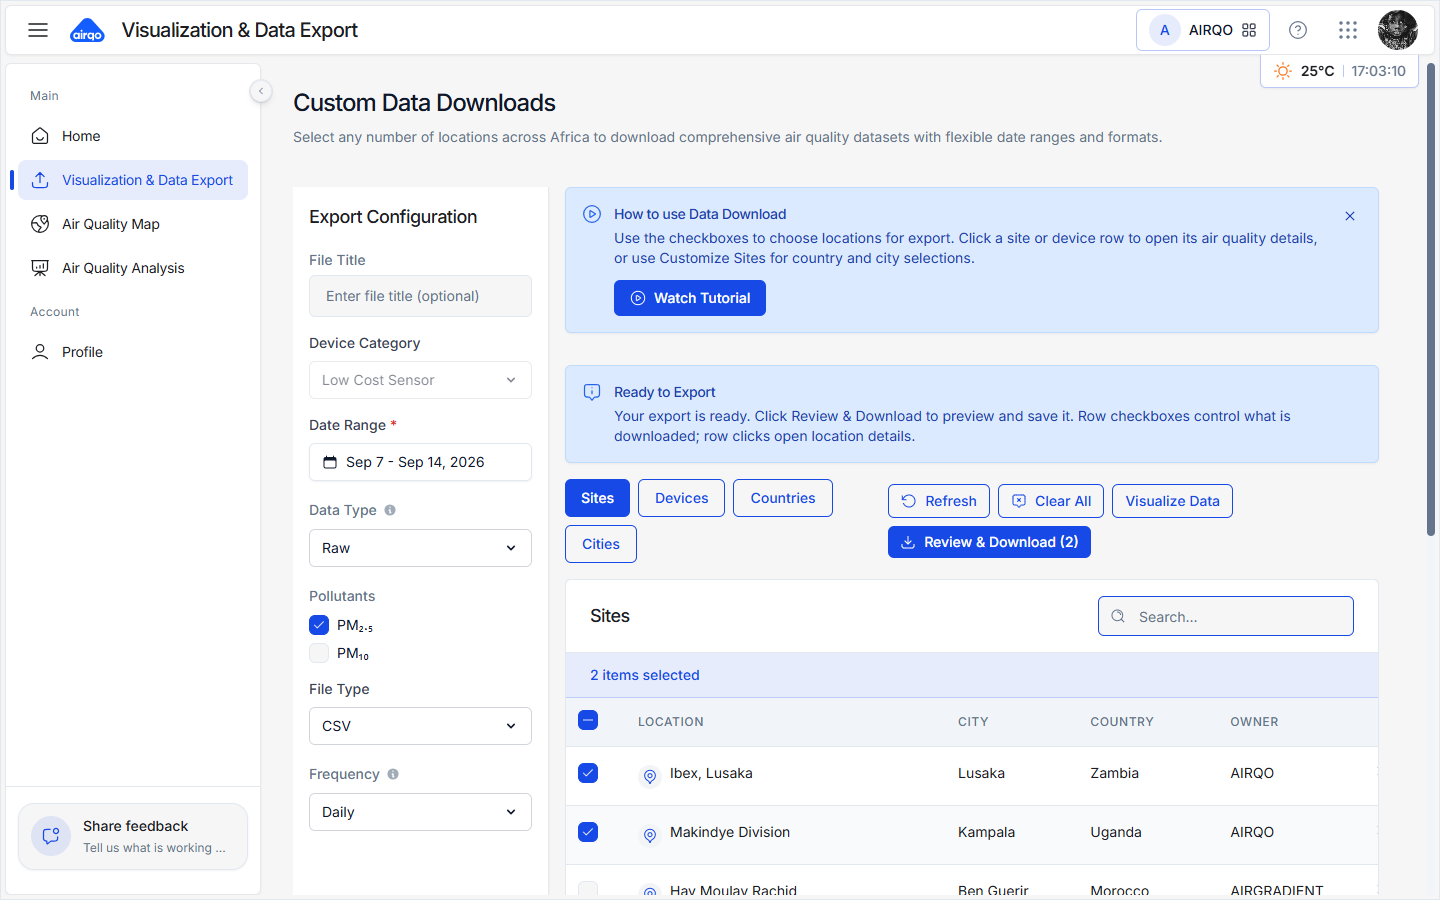
- Help banner: Open the in-product tutorial when you need a guided tour.
- Location tabs: Choose Sites, Devices, Countries, or Cities.
- Selection table: Search, paginate, and select the rows to include.
- Export Configuration: Set the title, device category, data type, pollutants, frequency, file type, and date range.
- Visualize Data: Open an insights chart for selected locations.
- Review & Download: Preview the selection, configure columns, and start the download.
Step 1: Select locations
Location tabs
| Tab | What it selects | Availability |
|---|---|---|
| Sites | Individual monitoring locations | Individual and organization |
| Devices | Individual devices and their categories | Individual and organization |
| Countries | A country and its monitoring sites | Individual only |
| Cities | A city and its monitoring sites | Individual only |
Search filters the current tab. The table shows 10 rows per page by default. The header checkbox selects the current page only; it does not select every row across all pages.
Selections persist when you change pages or tabs. Review & Download (N) displays the count for the active tab. Select Clear All to remove every selection across all tabs.
Customize a country or city
Selecting a country or city includes its sites by default. A summary card shows how many sites are included.
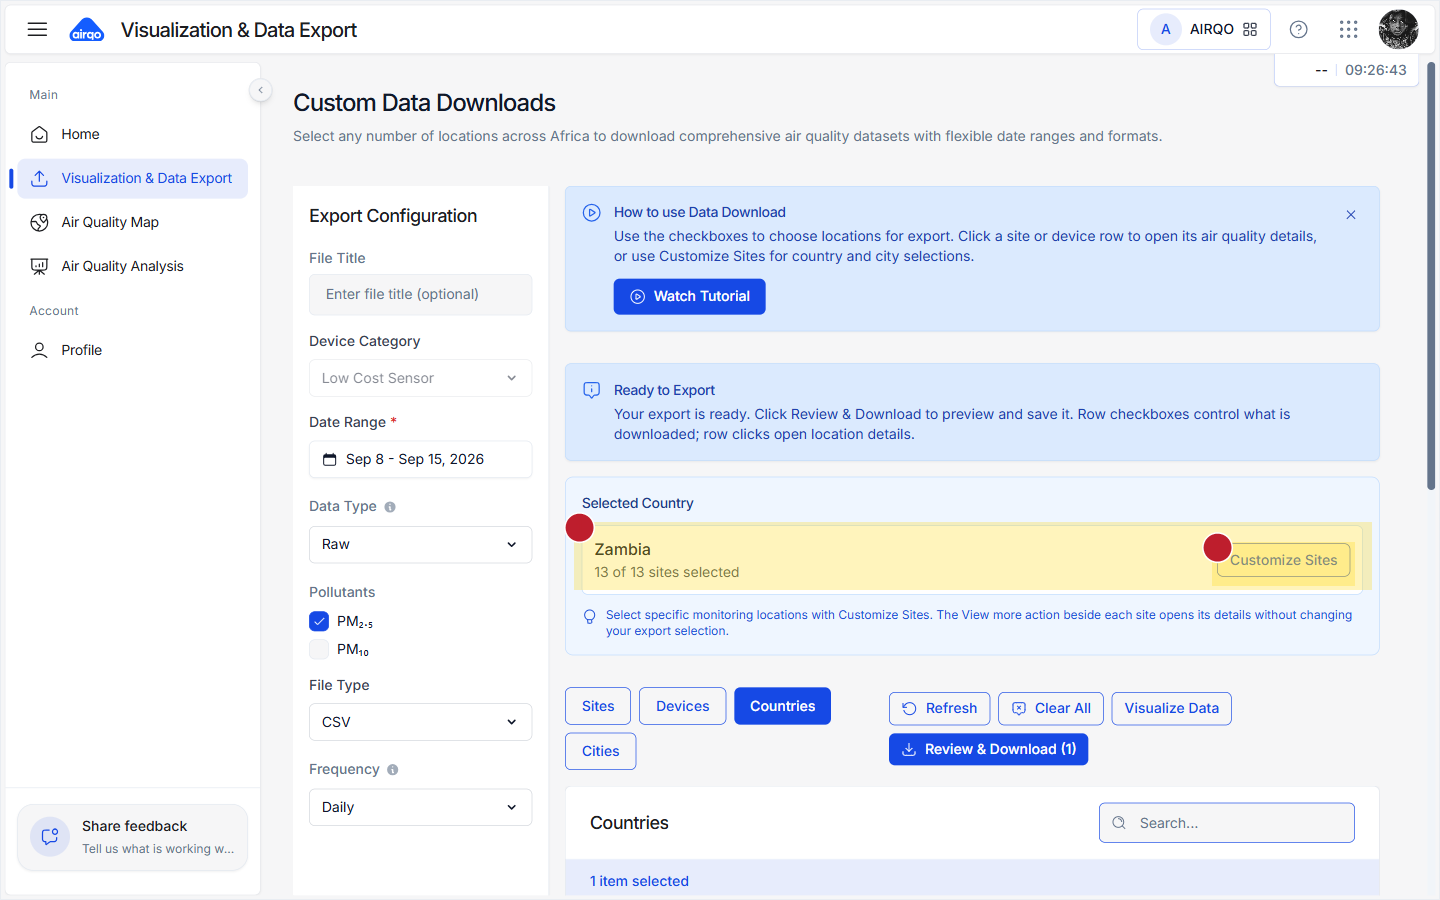
- Select Customize Sites or Modify Sites on the summary card.
- Search by site name, city, or country.
- Use Select All, Deselect All, or individual checkboxes.
- Select the footer action to confirm the selected sites.
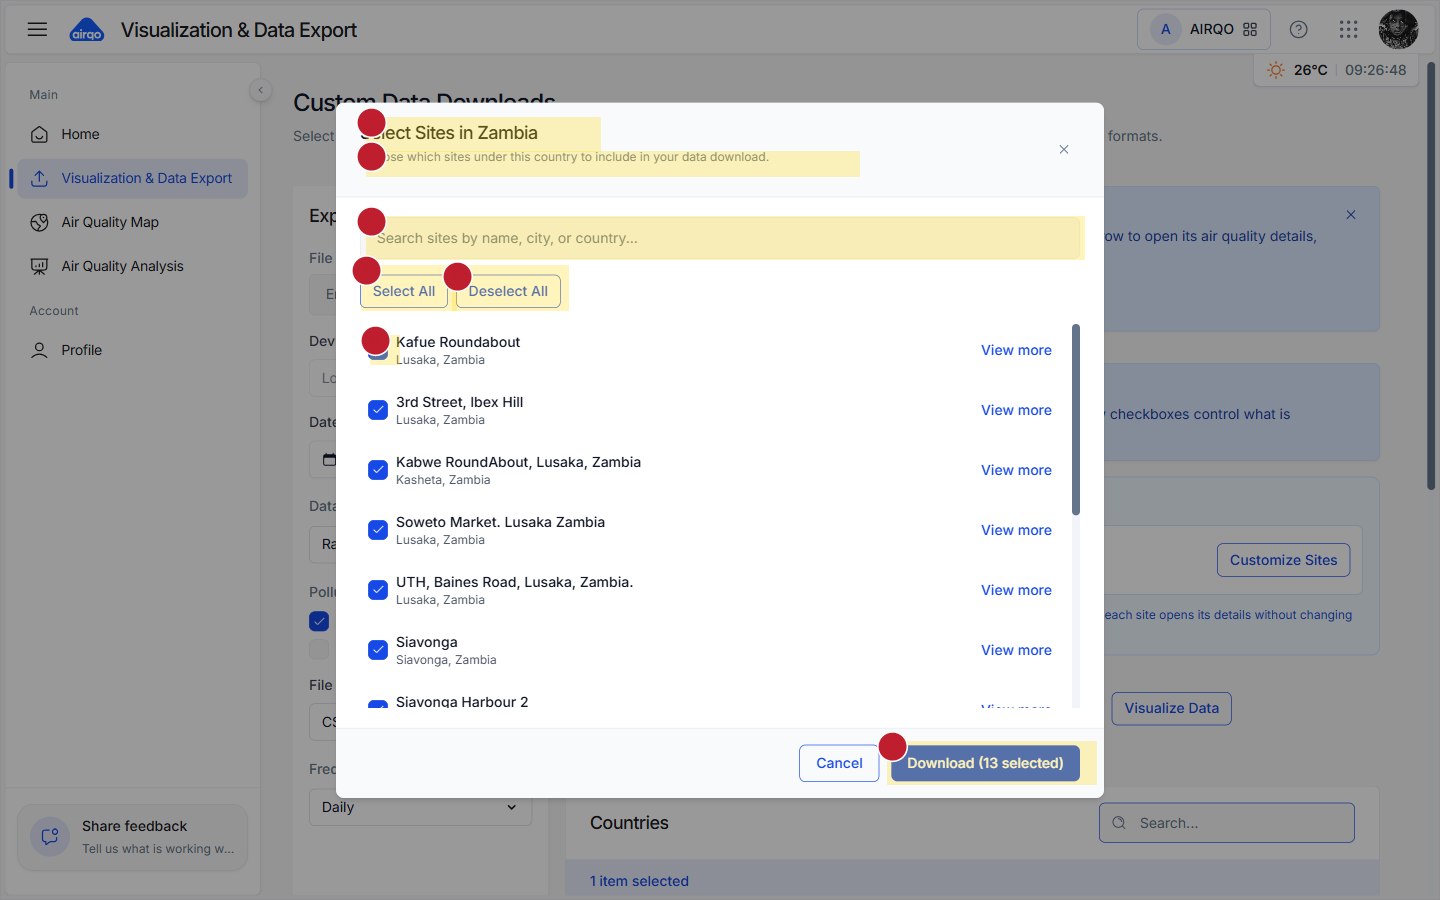
This is the recommended way to export only part of a city or country.
Step 2: Configure the export
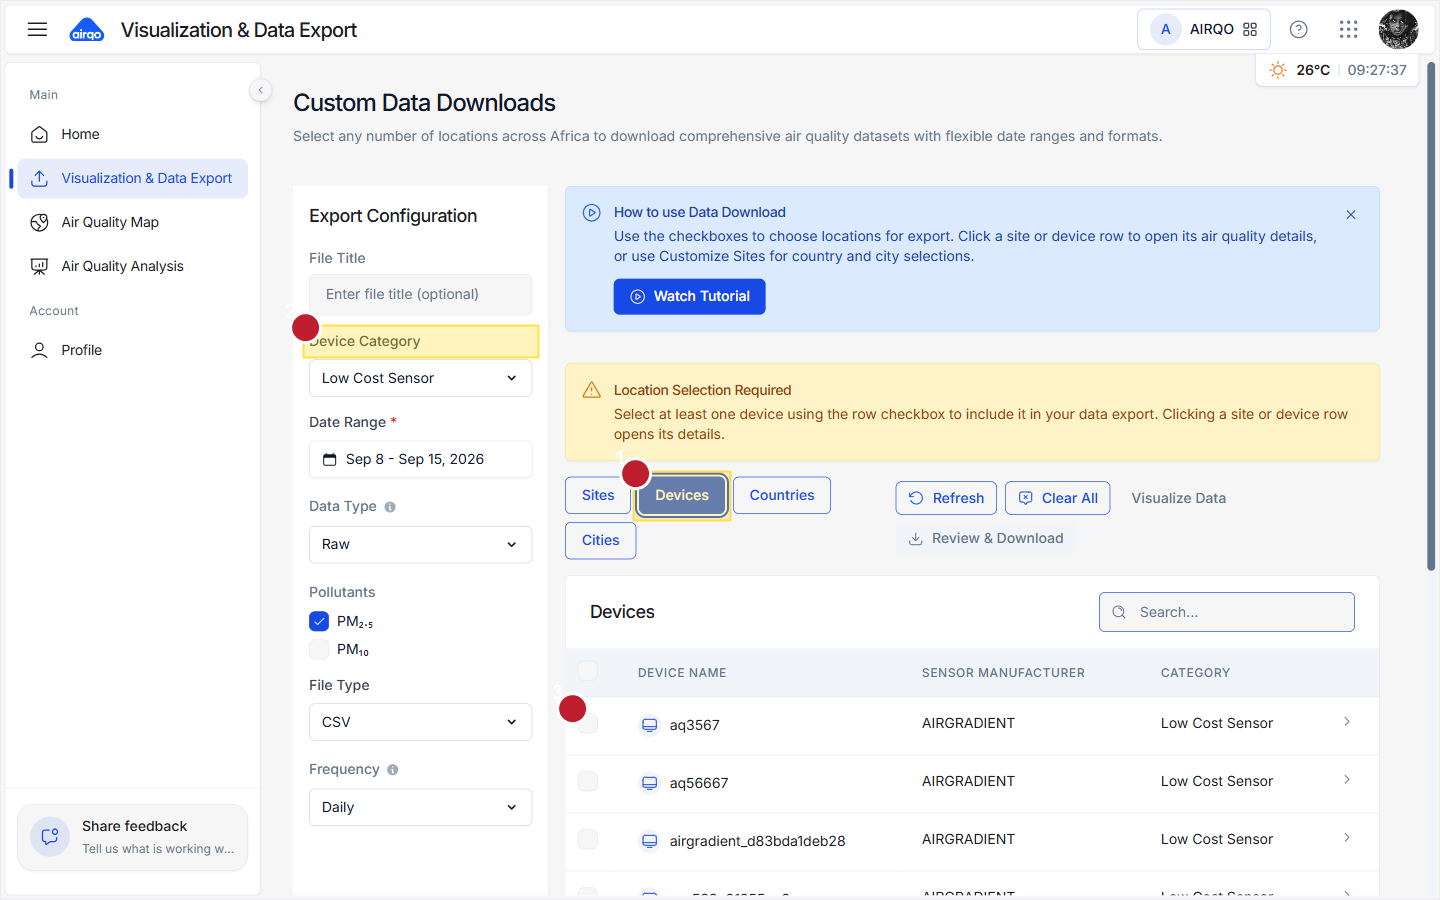
File title
Optional. Enter a short name such as kampala-pm25-january. If you leave it blank, Nexus generates a name from the export dates.
Device category
This control is active on the Devices tab. The available categories are:
| Category | Value | Behavior |
|---|---|---|
| Low Cost Sensor | lowcost | Standard low-cost sensor selection. |
| Reference Monitor | bam | Forces Data Type to Raw. |
| Mobile | mobile | Restricts Frequency to Raw. |
| Gas | gas | Gas-device selection. |
On Sites, Countries, and Cities, the device category control is disabled.
Data type
Data Type describes how the measurement is processed:
- Raw: Unprocessed sensor output.
- Averaged: Averaged readings.
- Calibrated: Quality-adjusted readings where available.
- Consolidated: Consolidated data for the selected request.
Reference monitors always use Raw. Remember that Data Type and Frequency are separate choices: Raw data type does not mean minute-level frequency.
Pollutants
Choose at least one pollutant:
- PM2.5 - fine particulate matter.
- PM10 - particulate matter with a larger aerodynamic diameter.
The selected pollutants affect the columns available in the preview and downloaded file.
Frequency
Frequency controls the time resolution or aggregation of the exported readings.
| Frequency | Meaning | Maximum range per request |
|---|---|---|
| Raw | Nexus raw-frequency option; use the direct API for finer-than-hourly data | 31 days |
| Hourly | One hourly aggregation | 90 days |
| Daily | One daily aggregation | 365 days |
| Weekly | One weekly aggregation | 365 days |
| Monthly | One monthly aggregation | 365 days |
| Yearly | One yearly aggregation | 365 days |
The available frequency options depend on the device category. Mobile devices are restricted to Raw. Other categories normally offer Hourly through Yearly.
Use the direct Raw Sensor Data API. It provides raw, minute-level readings through the raw-data endpoint. The direct API is the supported approach for sub-hourly downloads; do not rely on the Nexus export page's Raw data-type label for this use case.
File type
- CSV: Continues through the review step and then lets you choose CSV, Excel, or PDF.
- JSON: Downloads directly after confirmation and skips the format picker.
Date range
The default range is the last seven days. Nexus validates the range against the selected frequency and blocks requests that exceed the limit in the table above. For long periods, choose a coarser frequency or split the export into valid date ranges.
Step 3: Review and choose columns
Select Review & Download (N) to open the preview.
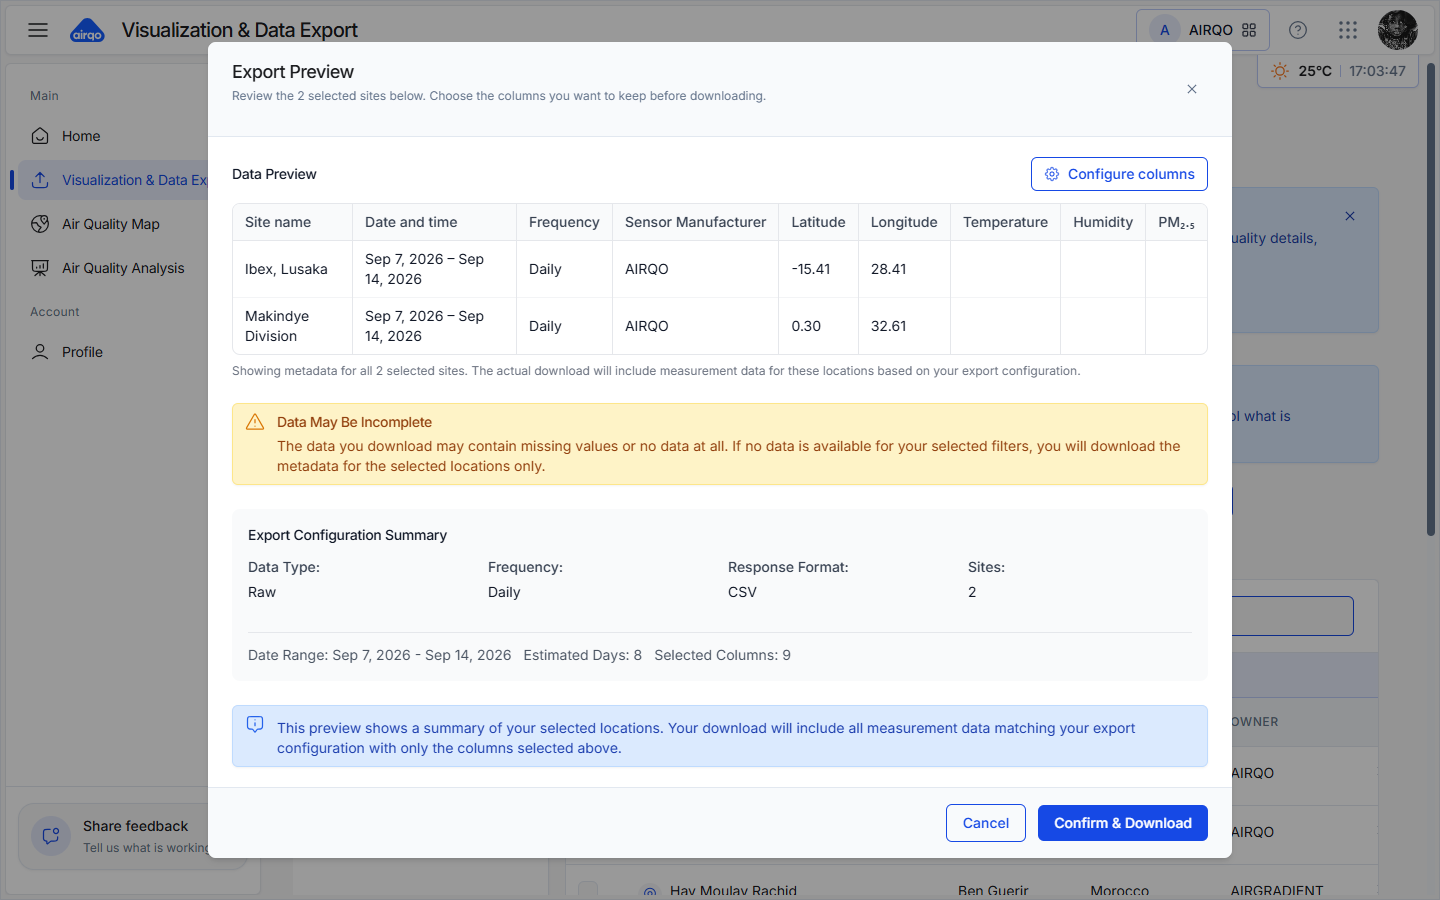
The preview shows:
- The selected locations and their metadata.
- The export configuration, including data type, frequency, response format, date range, and selected columns.
- A Configure columns control.
- A Data May Be Incomplete notice. This is informational and is always shown; it warns that readings can contain gaps or may be absent for the selected filters.
Configure columns
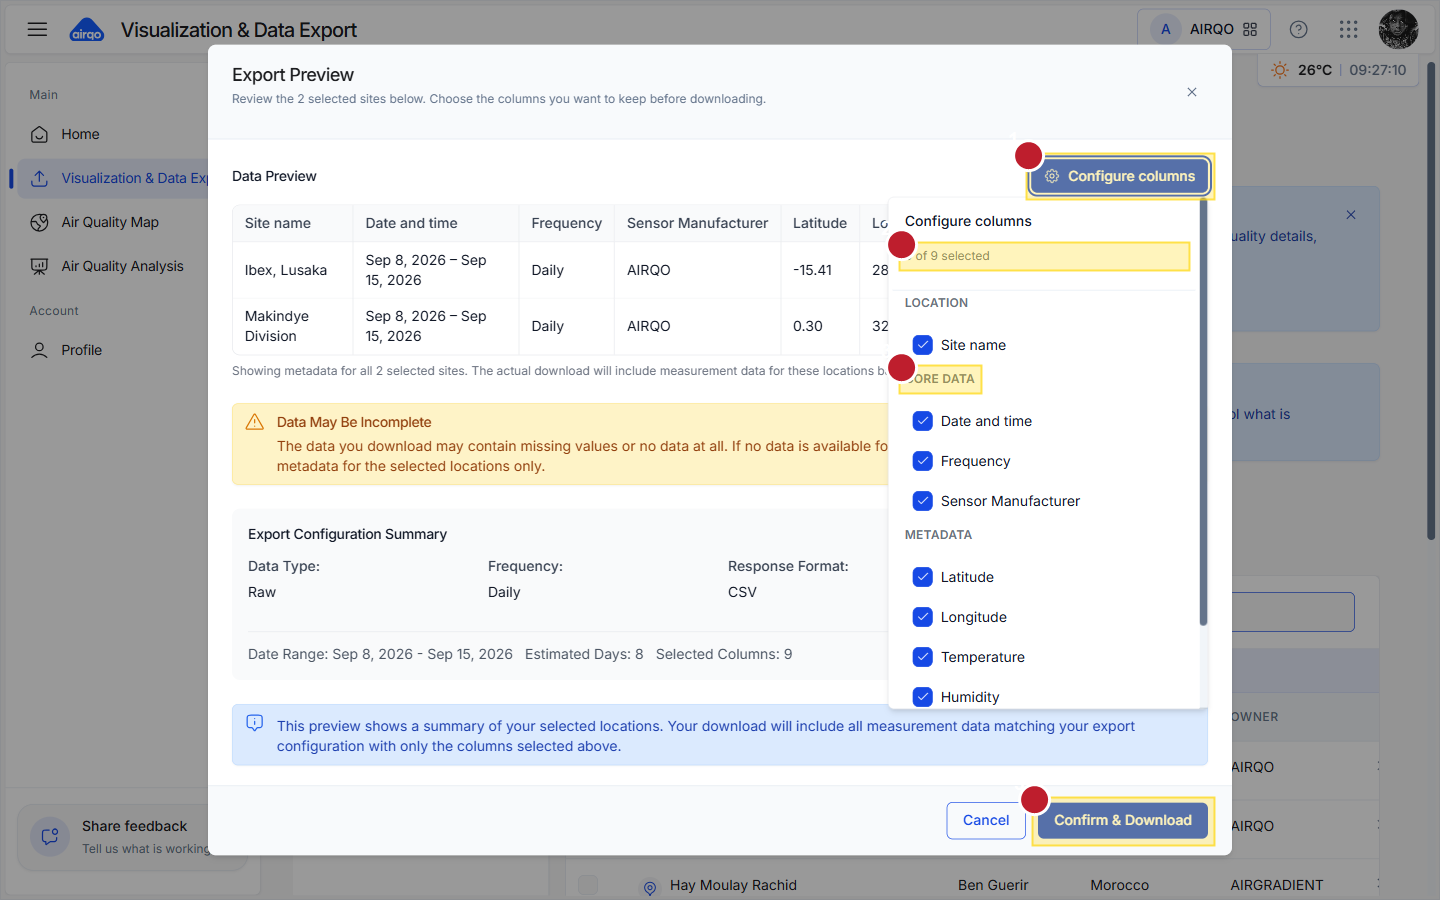
All available columns start selected. Use the column picker to remove fields you do not need. Groups can include:
- Location: Site or device name.
- Core data: Date and time, frequency, and sensor manufacturer.
- Metadata: Latitude, longitude, temperature, and humidity when available.
- Pollutants: The PM2.5 and PM10 fields selected in the export configuration.
At least one column must remain selected before downloading.
If there are no measurements, Nexus changes the primary action to a metadata-only download. The resulting file confirms the selected locations but does not contain measurement rows.
Step 4: Choose a download format
When the sidebar File Type is CSV, confirming the preview opens the format picker.
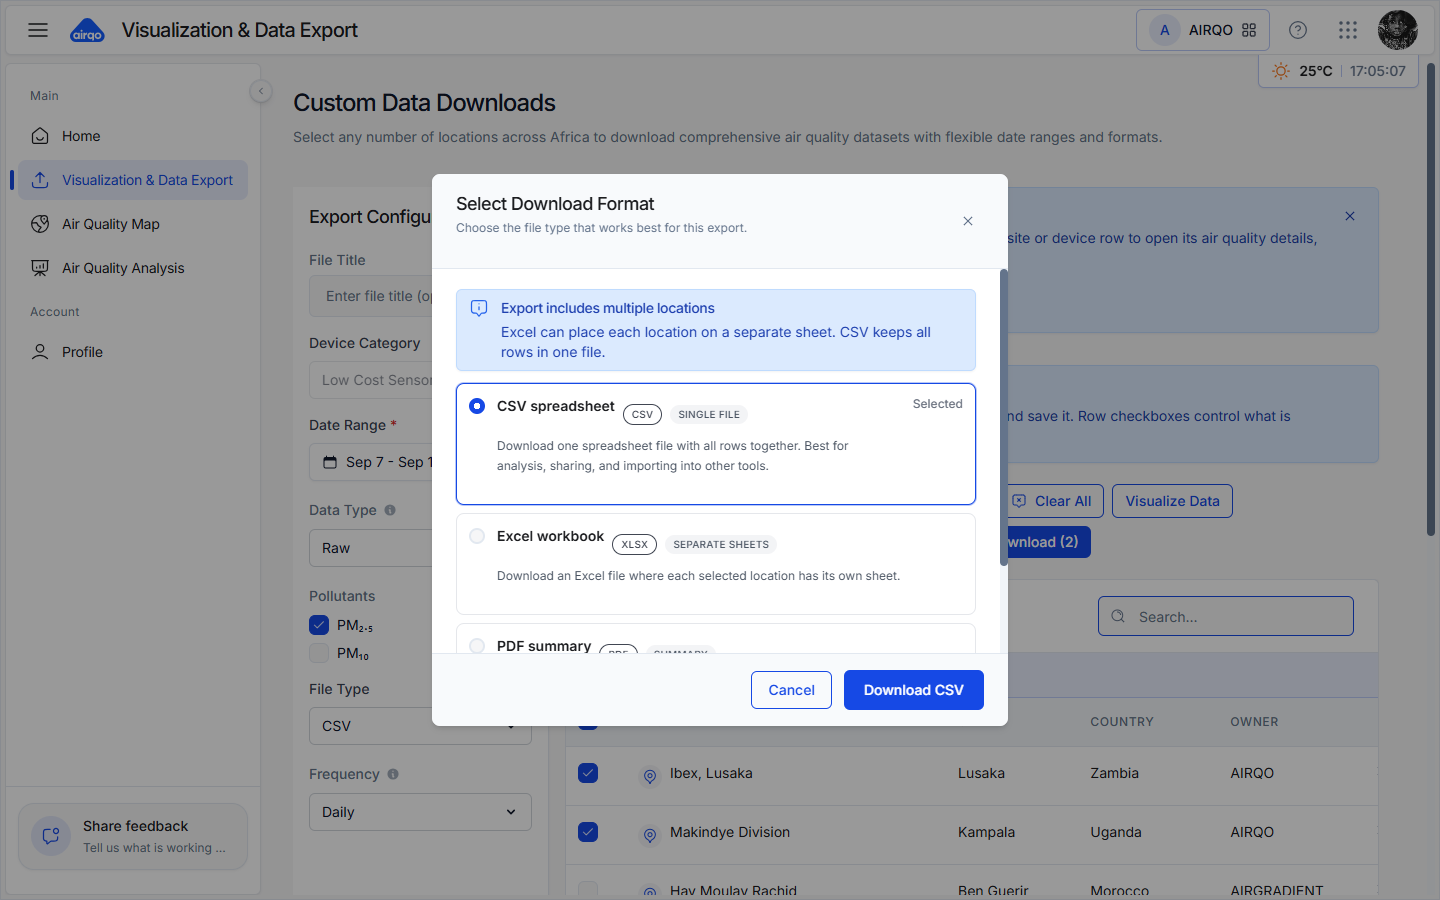
- CSV: One file containing all rows. Best for analysis and data exchange.
- Excel: One worksheet per selected location. Available when at least two locations are selected.
- PDF: A formatted summary. Large exports may be rejected; use CSV for large analytical datasets.
- JSON: Selected directly in the sidebar and downloaded without this dialog.
Default filenames use the export dates. A custom File Title replaces the default base name, and metadata-only downloads add -metadata.
Visualize selected data
Select rows and then choose Visualize Data to open Air Quality Insights. Use it to check selected locations, choose a pollutant and date range, and inspect a trend before downloading.
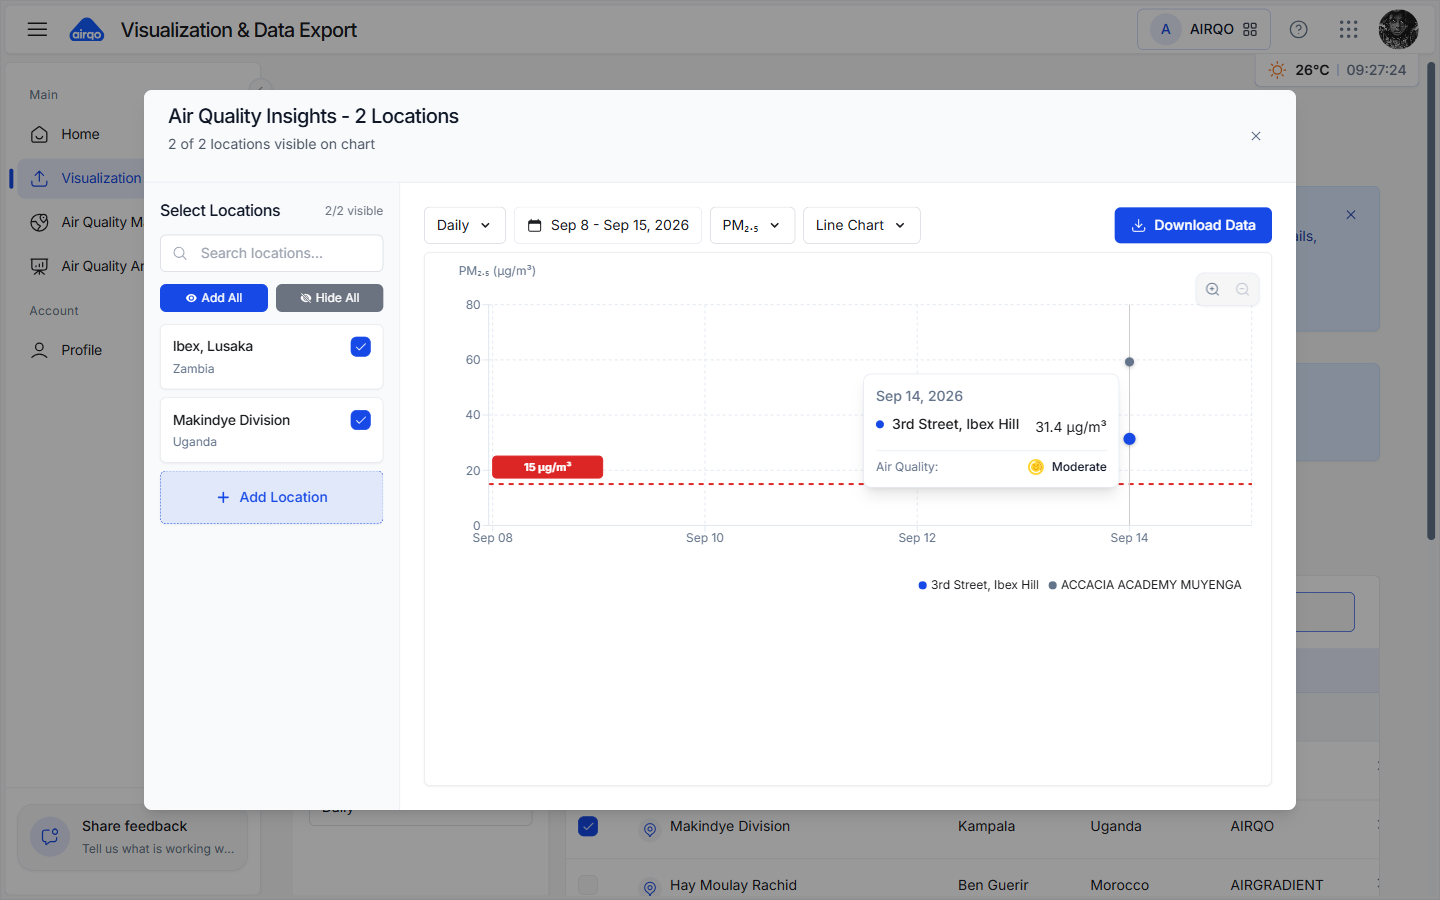
Selecting a table row can also open that site's details page, where you can review its current reading, recent trend, forecast, and health guidance.
Troubleshooting
| Issue | What to do |
|---|---|
| Review & Download is disabled | Select a date range, at least one location, and at least one pollutant. |
| Review & Download is not visible | Ask an organization administrator to grant the Data Export permission. |
| The date range is too large | Use the frequency-specific maximum: 31 days for Raw, 90 for Hourly, or 365 for Daily and coarser frequencies. |
| A country or city has no sites selected | Open Customize Sites and select at least one site, or deselect the grid. |
| The download contains only metadata | The selected filters returned no measurements. Try another period, location, pollutant, or data type. |
| PDF is too large | Reduce the date range or columns, or choose CSV. |
| Download fails | Retry once. If the problem continues, reduce the request size and check your connection. |
| Selection count looks wrong | The count in the header reflects the active tab; selections on other tabs remain stored. |
Recommended practices
- Give each export a descriptive File Title.
- Keep only the columns you need.
- Use CSV for large data analysis and Excel for a smaller, per-location workbook.
- Use JSON when another application or script consumes the response.
- Use Visualize Data before a large download to confirm that the selected locations are reporting.
- Split long requests according to the frequency-specific limits.
- Use the direct Raw Sensor Data API for finer-than-hourly or minute-level data.
Related guides
- Interactive Map - explore and inspect monitoring sites
- Air Quality Analysis - chart and compare locations
- Dataset Visualizer - upload and visualize your own files
- Nexus Console - create API clients and review access