Interactive Map
The Interactive Map lets you explore air-quality readings from monitoring sites across Africa. Search for locations, filter by country or provider, switch pollutants, change the map display, and inspect current readings, forecasts, and health guidance.
Open the map
- Sign in to AirQo Nexus.
- Select Air Quality Map in the workspace sidebar.
Individual URL: https://nexus.airqo.net/user/map
Organization URL: https://nexus.airqo.net/org/<your-org>/map
Map layout
- Map canvas: Displays monitoring sites, clusters, or heatmap coverage.
- Sidebar: Provides search, country and provider filters, the location list, and site details.
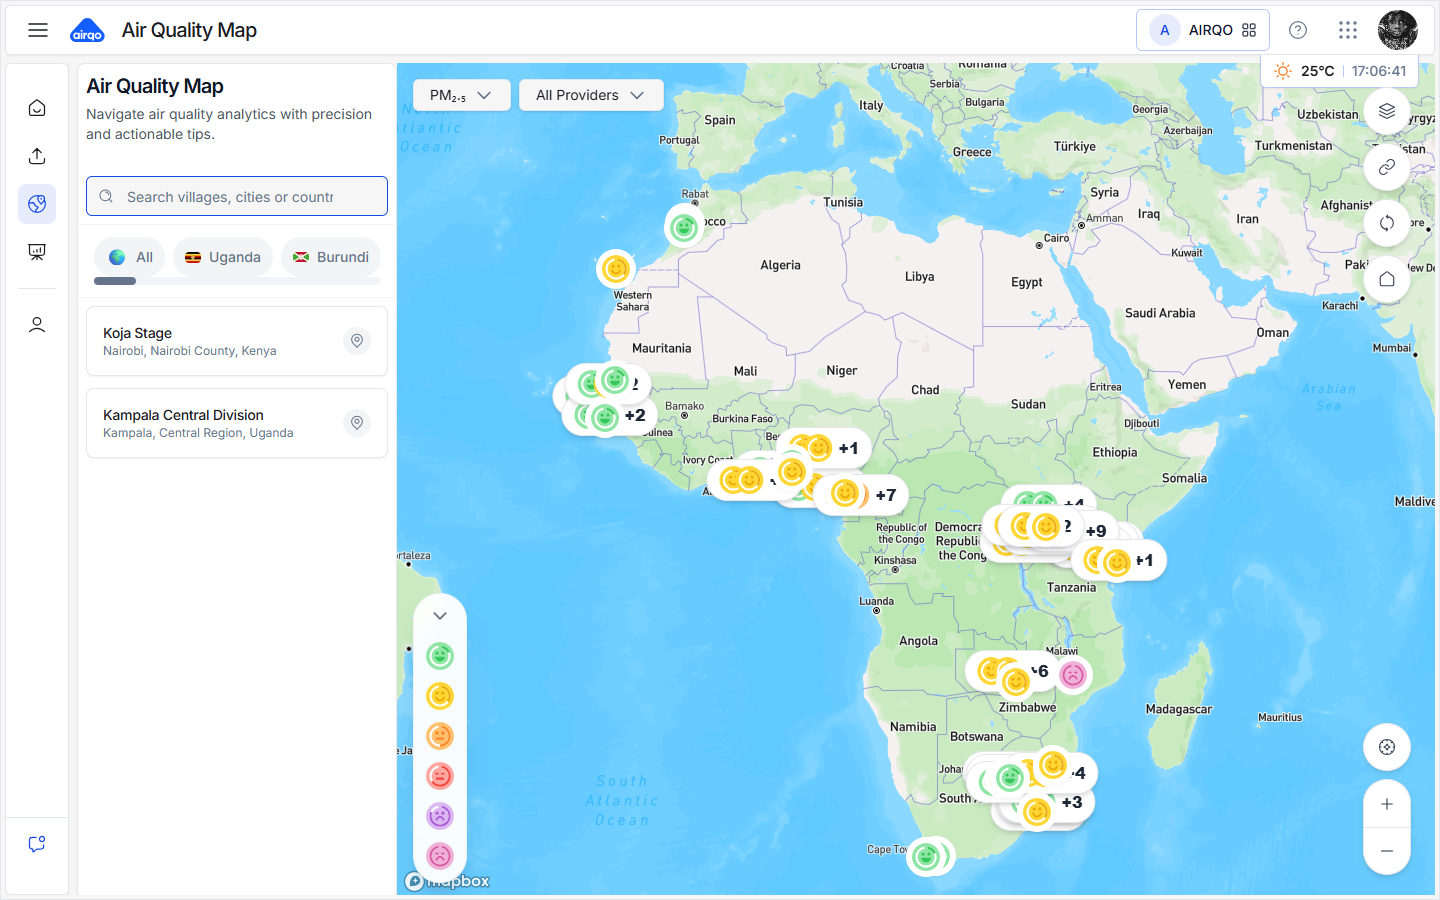
Map displays
Station markers
When stations are close together, Nexus groups them into a cluster. Select a marker or cluster to focus the map and open more information.
In Map Settings, choose Emoji, Node, or Number:
| Display | Use it to... |
|---|---|
| Emoji | See a category icon for each station. |
| Node | See a simple colored station marker. |
| Number | See the selected pollutant value on the marker. |
Spatial heatmaps
The Heatmap display is available on individual maps when spatial heatmap coverage is available. It shows city-level coverage areas rather than individual station markers.
- Open Map Settings and choose Heatmap.
- At the overview, select a city pointer to explore its heatmap coverage.
- Use Focus heatmap coverage to fit the available areas in the map.
If there is no coverage or the heatmap service is unavailable, Nexus keeps station markers visible and shows a status message. Heatmaps are currently unavailable on organization maps.
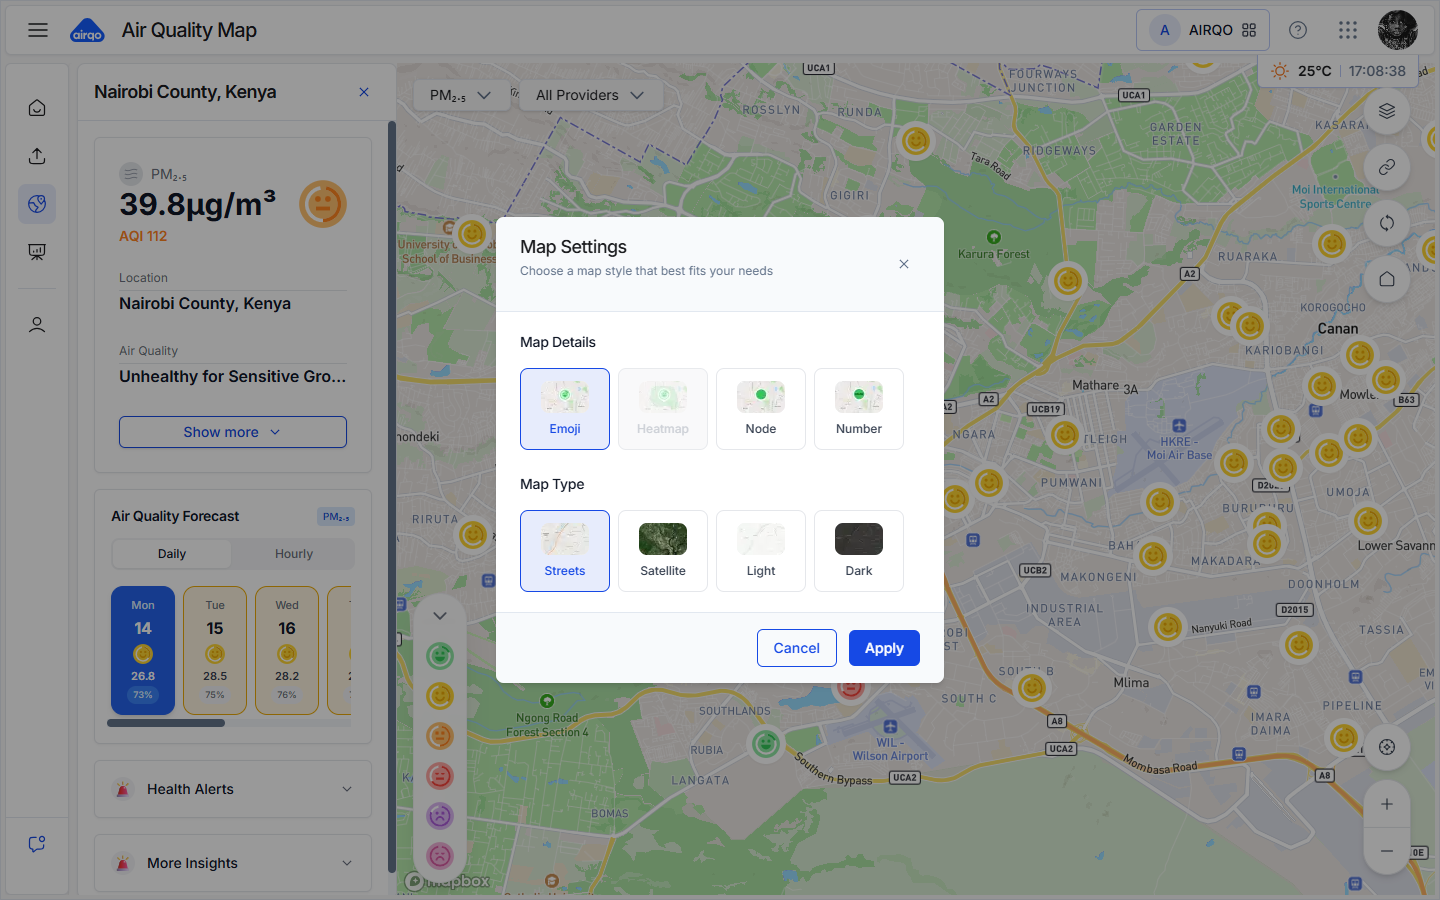
Base map styles
Choose one of these base maps:
| Style | Description |
|---|---|
| Streets | Road and place names. |
| Satellite | Aerial imagery. |
| Light | Minimal light-colored map. |
| Dark | Minimal dark-colored map. |
Select Apply to save the display choices.
Map controls
| Control | What it does |
|---|---|
| Map styles | Opens Map Settings. |
| Copy map link | Copies a link containing the current map position and pollutant. |
| Refresh map | Requests fresh station readings; in heatmap mode it also refreshes coverage when available. |
| Reset to default view | Returns to the initial position and zoom. |
| Find my location | Centers the map on your current geographic location when permission is granted. |
| Zoom in / Zoom out | Changes the map scale. |
Search and filter sites
- Search: Find a city, country, or monitoring location.
- Country: Limit the location list to one country. Select the country again to clear the filter.
- Provider: When more than one data provider is available, choose a provider or All Providers.
- Location list: Select a site to fly to it and open the details panel.
Site details
Select a monitoring site to open its details panel.
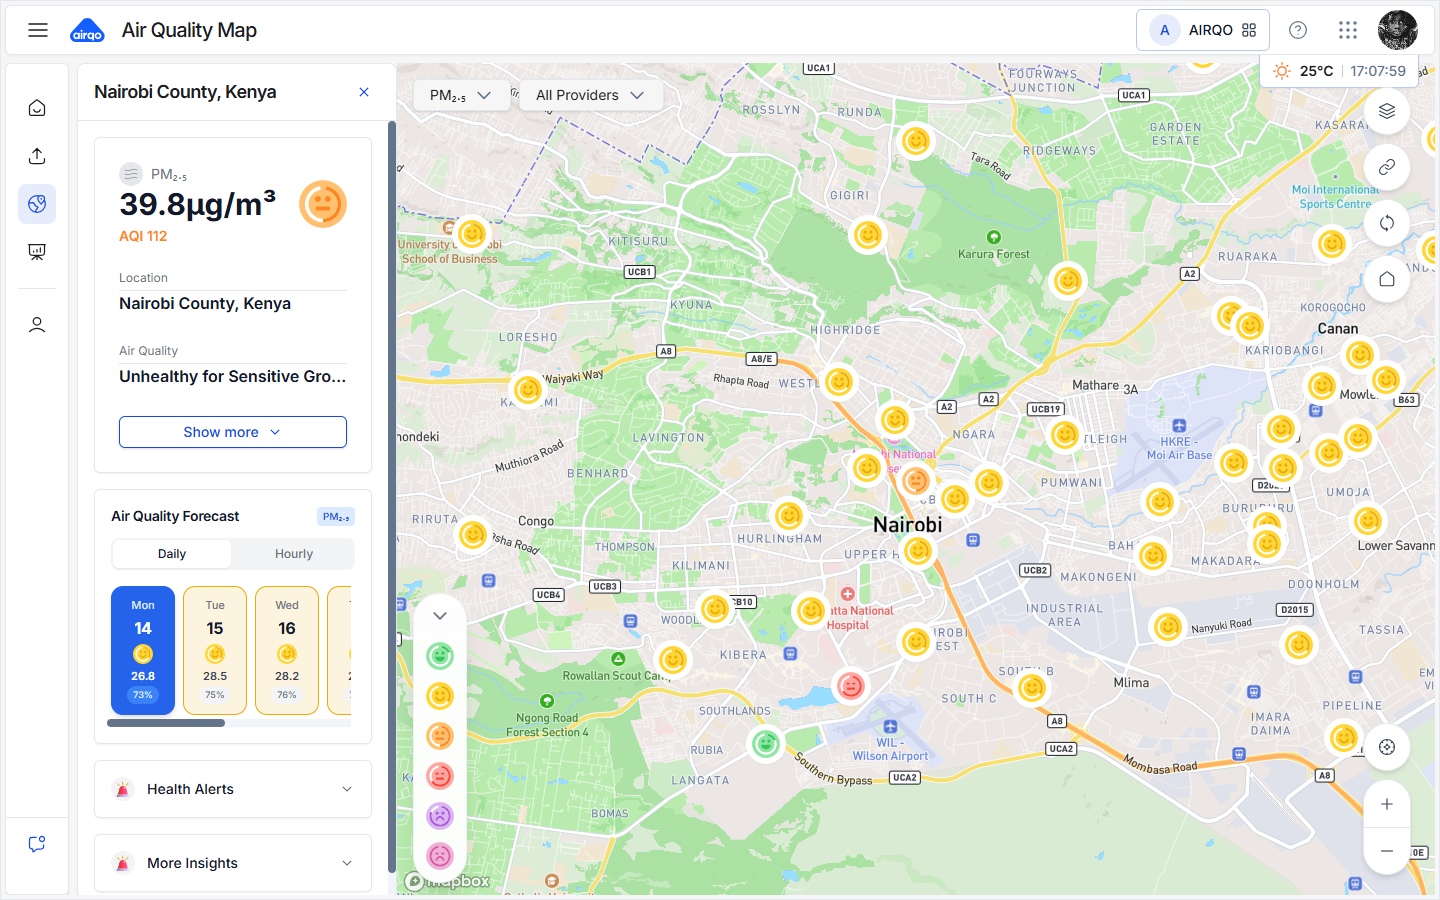
Current reading
The panel can show:
- The selected pollutant and its value.
- The AQI value and category.
- Site name, provider, monitor, device category, and deployment type.
- City and country.
- The reading timestamp as displayed by Nexus.
Forecast
Forecasts can be viewed as:
- Daily: Up to the next seven days.
- Hourly: Up to the next 24 hours.
Forecast cards may include AQI, PM2.5, confidence, temperature, humidity, and trend information. Forecasts are unavailable when the selected site does not have enough data or the forecast service has no result.
Health guidance and insights
- Health Alerts: Expand the card for site-specific or general guidance related to the current category.
- More Insights: Expand the card to view a recent historical trend for the site.
Select the close button at the top of the panel to return to the location list.
Switch pollutants and read the legend
Use the pollutant selector to switch between PM2.5 and PM10. Markers, tooltips, site details, and the legend update to match the selected pollutant.
The collapsible legend shows the active categories and ranges. See Air Quality Levels for interpretation guidance.
Organization workflow
The organization map is scoped to sites in the organization's selected cohort. Spatial heatmaps are not available in this workflow; use station markers, the location list, and site details instead.
If the organization has no cohort or no available readings, the map may show an empty state. Contact an organization administrator if you expected sites to be available.
Troubleshooting
| Issue | What to do |
|---|---|
| Map does not load | Check your connection and retry the page. |
| No markers appear | Zoom out, clear the country or provider filter, and check that the current workspace has available sites. |
| Heatmap is unavailable | Continue with station markers, or try the individual map where spatial coverage is supported. |
| Forecast is unavailable | Try another site or a different pollutant; forecasts require sufficient data. |
| Organization map is blank | Ask an administrator to check the selected cohort and its assigned devices. |