Air Quality Analysis
Air Quality Analysis helps you study monitored locations over time and compare their latest readings. It has two views:
- Trends: Build, save, and export charts for selected sites.
- Comparison: Review the latest readings for several sites side by side and save the selection.
The page is available in individual and organization workspaces. Organization users see data scoped to their current organization.
Open Air Quality Analysis
- Sign in to AirQo Nexus.
- Select Air Quality Analysis in the workspace sidebar.
- Choose Trends or Comparison at the top of the page.
Individual URL: https://nexus.airqo.net/user/air-quality/analytics
Trends
The Trends view displays saved charts in either List or Grid layout. Select New chart to create a chart.
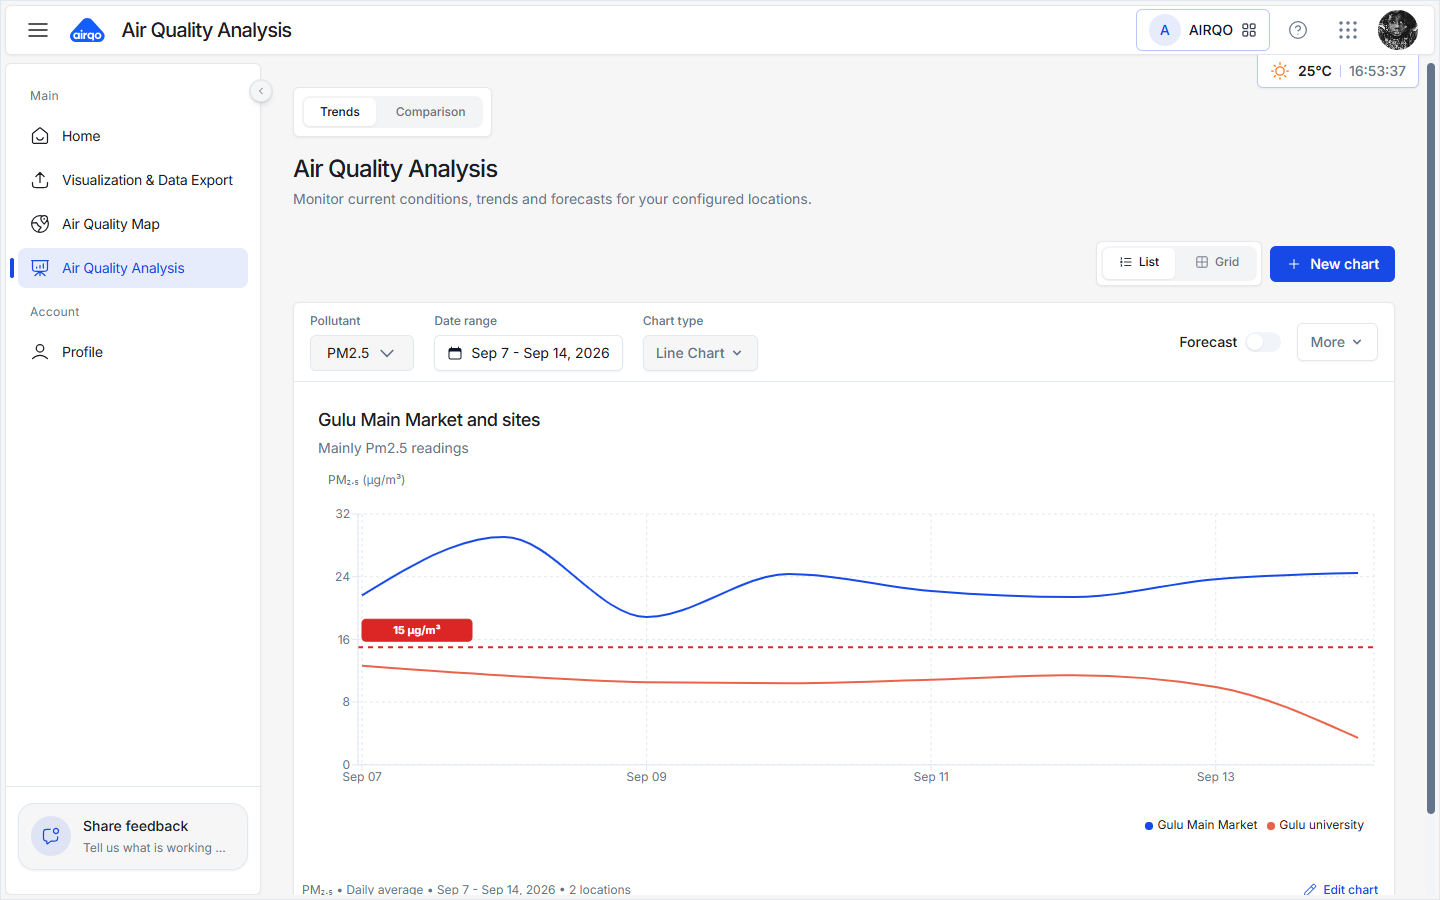
Create a chart
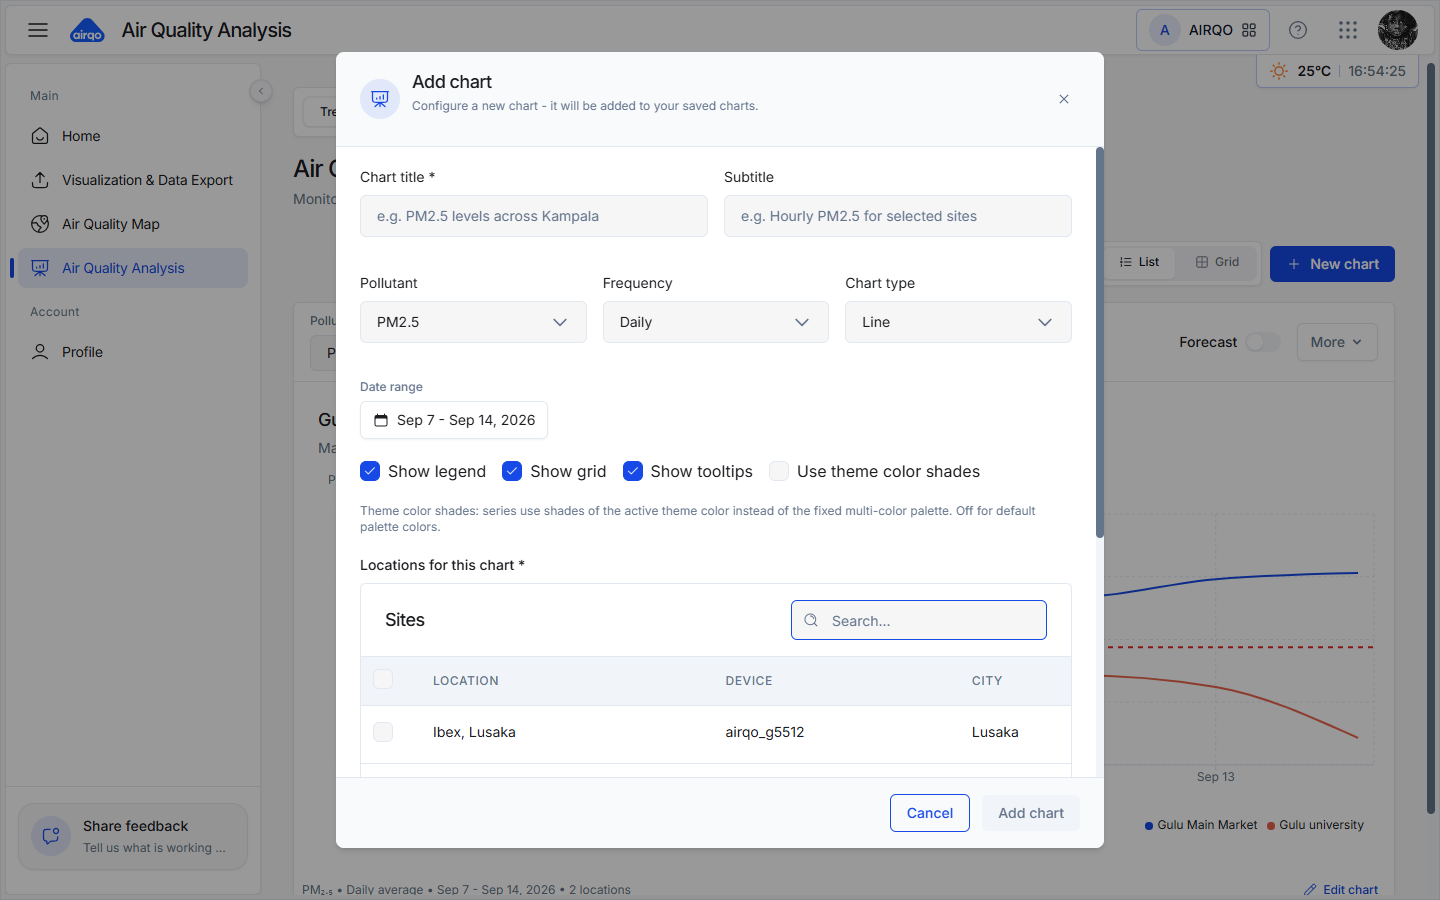
- Select New chart.
- Enter a required Chart title and an optional Subtitle.
- Choose a Pollutant: PM2.5 or PM10.
- Choose a Frequency: Raw Data, Hourly, Daily, Weekly, Monthly, or Yearly. Availability depends on the selected data and service response.
- Choose a chart type: Line, Area, Bar, or Pie.
- Set the date range and select one or more monitoring sites.
- Optionally set a color for each location and enable or disable the legend, grid, tooltips, and theme color shades.
- Select Add chart.
Manage saved charts
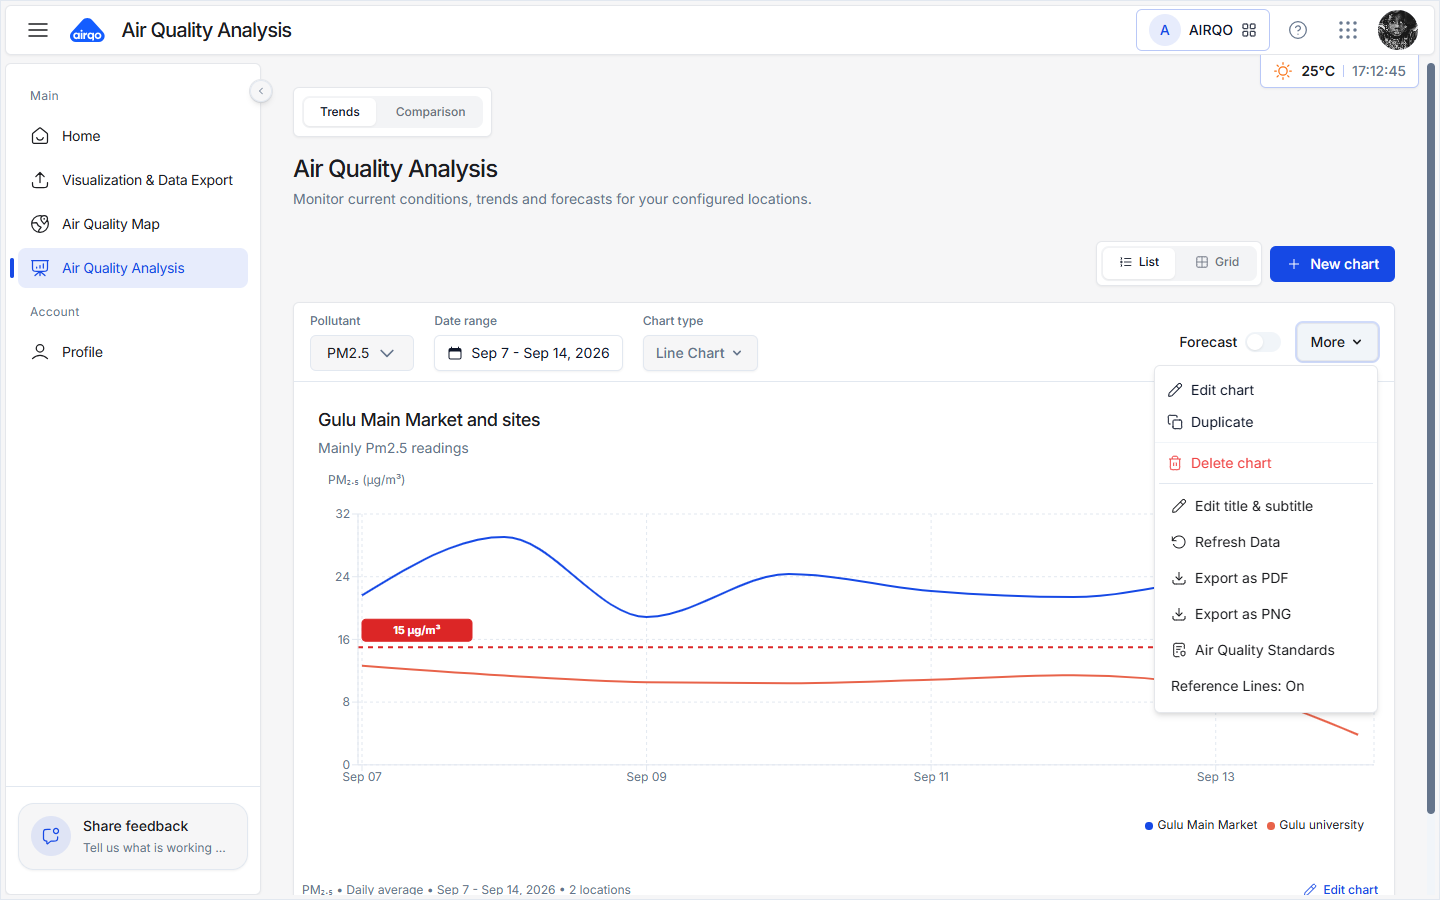
Chart cards support:
- Inline title and subtitle edits.
- A quick chart-type change where supported.
- Refreshing the chart data.
- A forecast toggle for supported PM2.5 chart configurations. Forecast lines extend observed data with available daily forecasts; they are not additional observations.
- Edit chart, Duplicate, Delete chart, Export as PDF, and Export as PNG from the More menu.
- Air Quality Standards and Reference Lines when available in the chart controls.
If one or more selected sites have no readings for the selected period and frequency, Nexus shows a warning and omits those series. Try another date range or frequency.
The Raw Data chart option is separate from the Raw data type on the export page. If you need a downloadable sub-hourly or minute-level dataset, use the direct API workflow described in Raw Sensor Data.
Comparison
The Comparison view is designed for a current snapshot rather than a time-series chart.
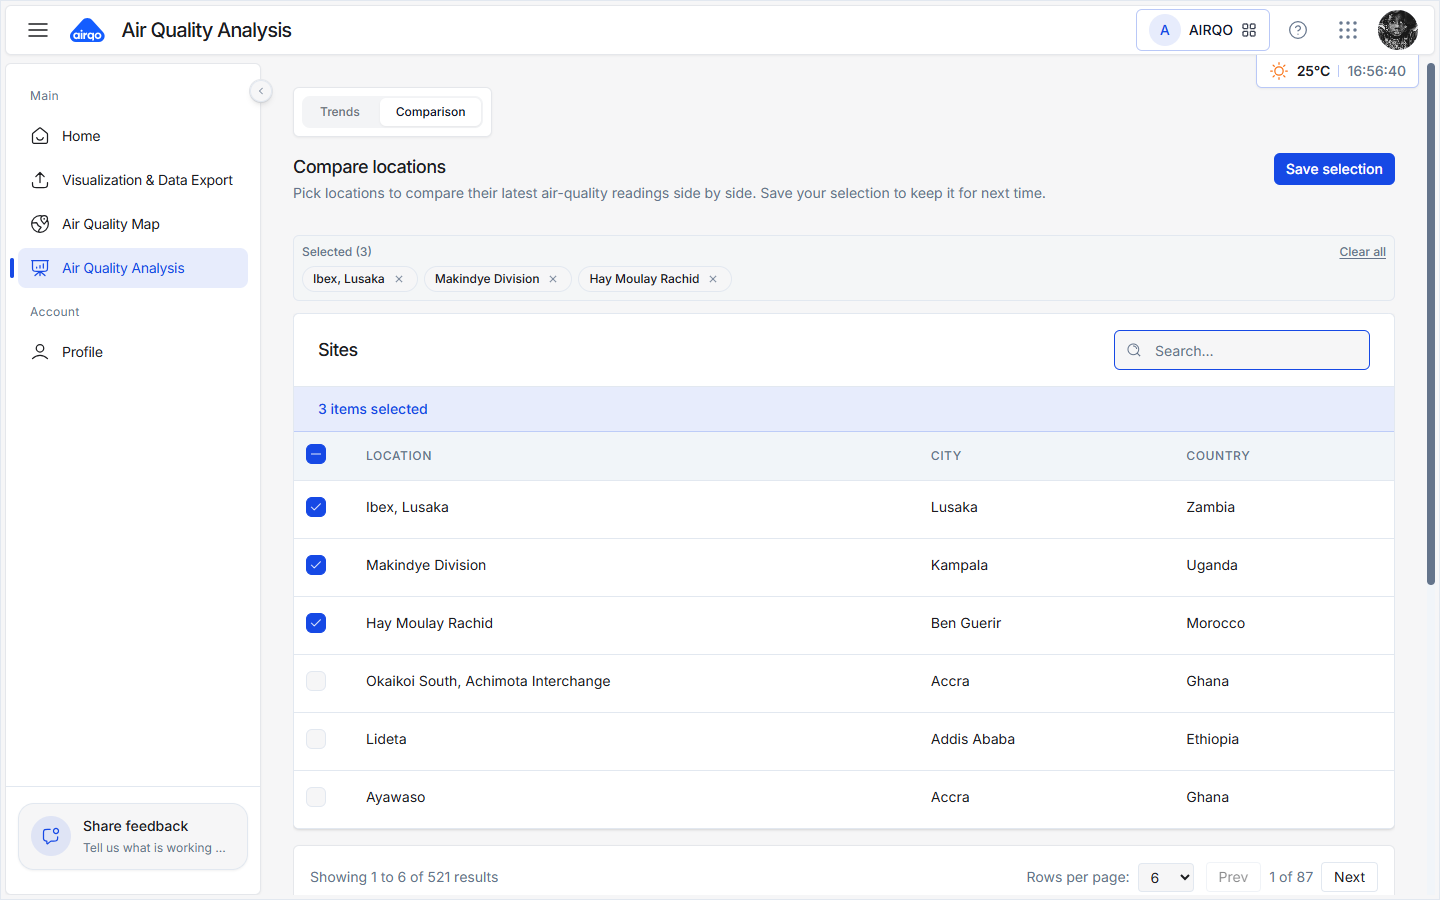
- Use Compare locations to select the sites you want to review.
- Review the latest readings in the table. Rows can include AQI, PM2.5, PM10, other available pollutants, last reading, and freshness.
- Use the table controls to sort the rows. A site with no current reading remains visible as No reading.
- Select a site to view its details, or select View insights for a site or selected group.
- Select Export to download the comparison table as CSV.
Save and load a comparison
- Select Save selection and give the comparison a name.
- Use Saved comparisons to load, update, or delete a saved selection.
- The most recently used comparison can be restored for the current workspace.
AQI legend
The legend below the comparison table can be switched between PM2.5 and PM10. It uses the current Nexus air-quality configuration. See Air Quality Levels for guidance on categories and thresholds.
Exporting chart images
Use a chart card's More menu to export the visualization as PDF or PNG. These files contain the chart image, not the underlying measurement dataset. For data files, use Export Air Quality Data.
Related guides
- Interactive Map - inspect a location's current reading, forecast, and health guidance
- Air Quality Rankings - compare African countries and cities
- Export Air Quality Data - download measurement data
- Air Quality Levels - understand categories and colors