Upload & Visualize Air Quality Data
The Dataset Visualizer lets you upload your own air quality files, compare sources, and create export-ready charts. Upload CSV or XLSX files (up to 100 MB each), and the visualizer auto-profiles the columns so you can start charting immediately.
Accessing the Visualizer
- Log in to AirQo Nexus.
- Open the global sidebar and select Dataset Visualizer.
- Direct links:
- Individual workflow: nexus.airqo.net/user/data-visualizer
- Organization workflow:
https://nexus.airqo.net/org/<your-org>/data-visualizer
Uploading Files
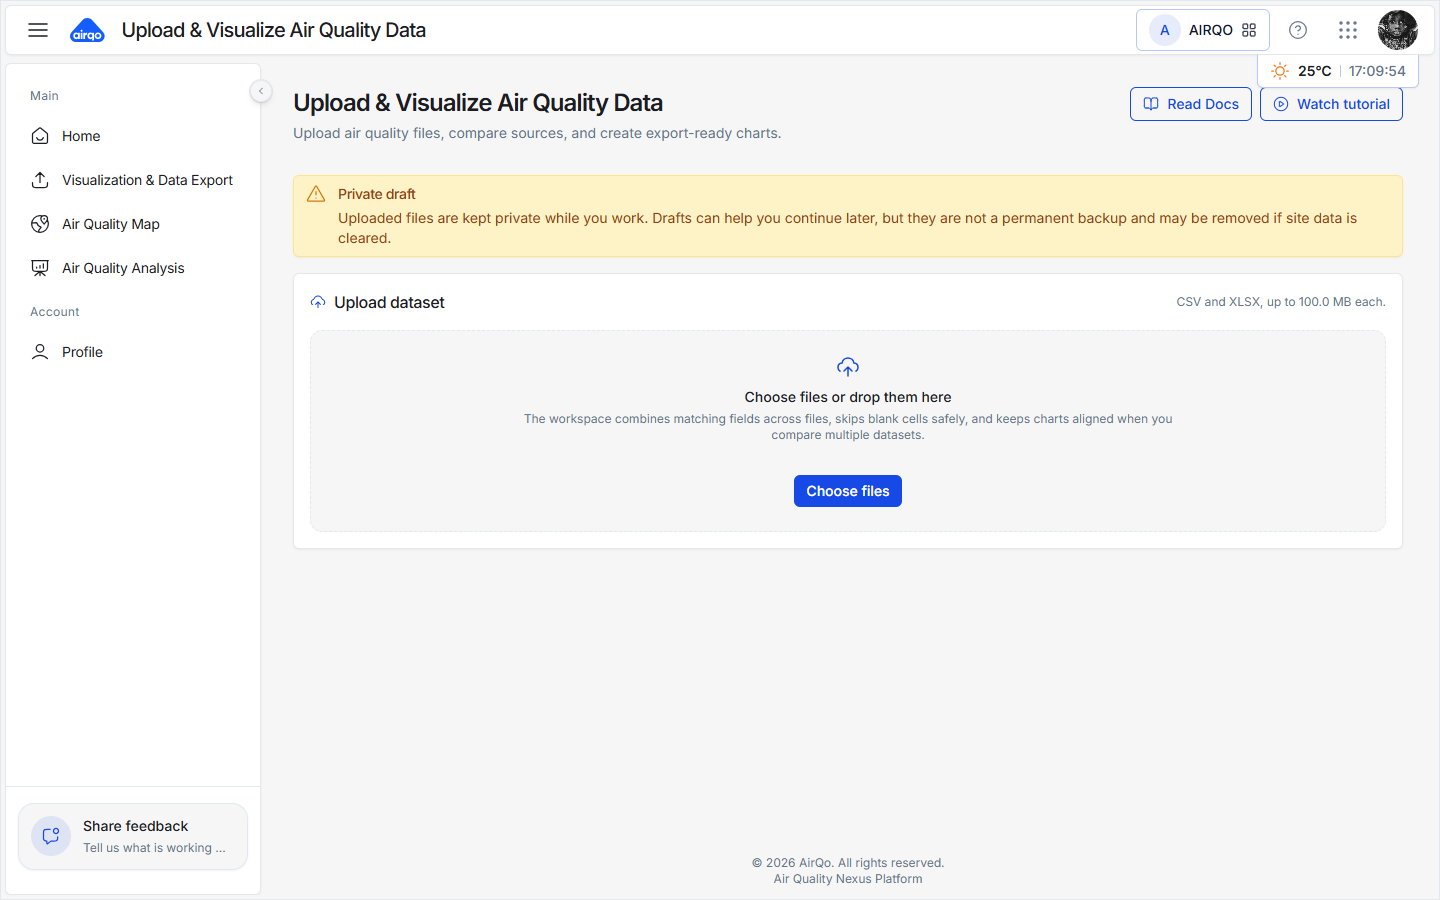
When you first open the visualizer, you'll see the empty state with an upload zone and a toolbar.
Supported Formats
| Format | Extension | Max Size |
|---|---|---|
| CSV | .csv | 100 MB |
| Excel Workbook | .xlsx | 100 MB |
How to Upload
The upload card header shows the supported formats and size limit: CSV and XLSX, up to 100.0 MB each. Below that, the drag-and-drop zone displays the prompt "Choose files or drop them here".
- Select Choose files or drop them here, or drag and drop files onto the upload zone.
- You can upload multiple files at once to compare sources side by side.
Toolbar
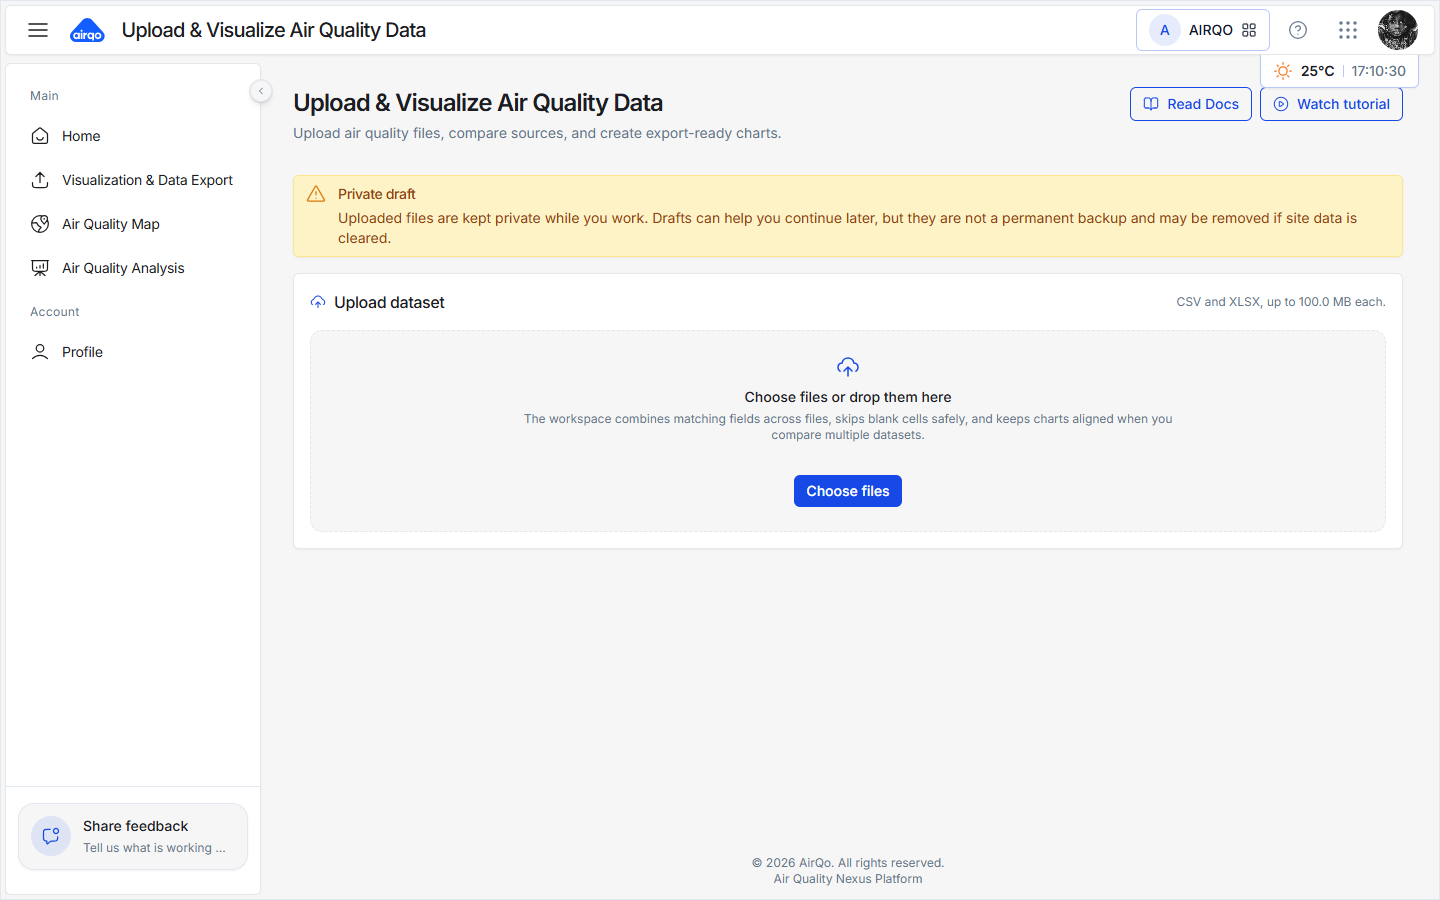
The toolbar above the workspace provides the following actions:
| Button | Description |
|---|---|
| Read Docs | Open this documentation |
| Watch tutorial | Play a walkthrough video |
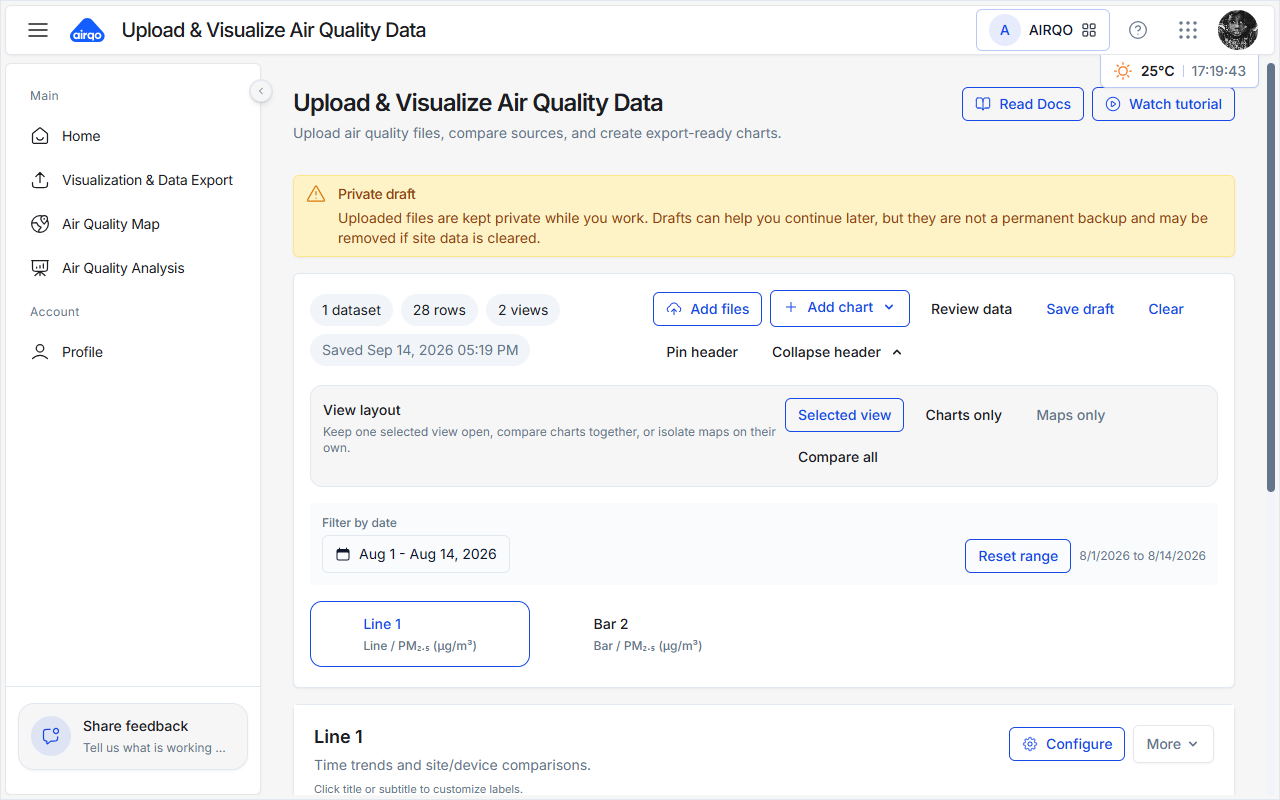
| Add files | Upload more files |
| Add chart | Create a new chart (clickable even without data — shows a toast prompting you to add data first) |
| Review data | Toggle the data review panel |
| Save draft | Save your work manually |
| Clear | Reset the workspace |
| Pin header / Collapse header | Control the header's behavior |
After Upload
Once a file is uploaded, the workspace shows your dataset (including the row count) and automatically creates default Line and Bar charts — for example, a PM₂.₅-by-date line chart with series grouped by site.
Column Auto-Detection
The visualizer automatically profiles every column in your file and classifies it:
| Column Kind | Examples | Used For |
|---|---|---|
| Time / Date | date, time, datetime, timestamp, … | X-axis for trend charts |
| Measurement | pm2_5, pm10, aqi, no2, o3, so2, co, temperature, humidity, … | Metrics and values |
| Dimension / Location | site, device, city, country, … | Grouping and comparison |
Review Imported Data
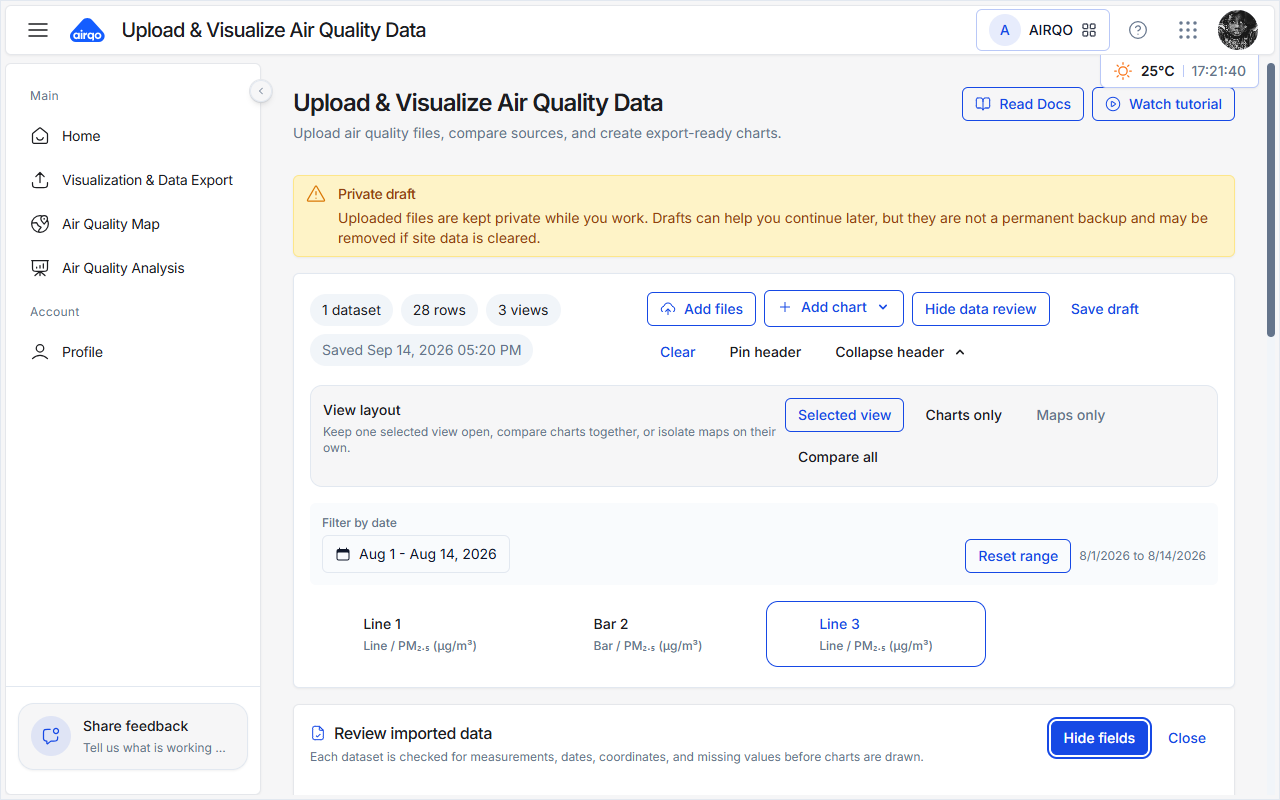
Select Review data in the toolbar to open the Review imported data panel. It lists every detected field together with its type so you can confirm the auto-detection was correct.
Creating Charts
Adding a Chart
- Select Add chart in the toolbar. If no data is loaded yet, a toast prompts you to upload a file first.
- Choose a chart type from the dropdown.
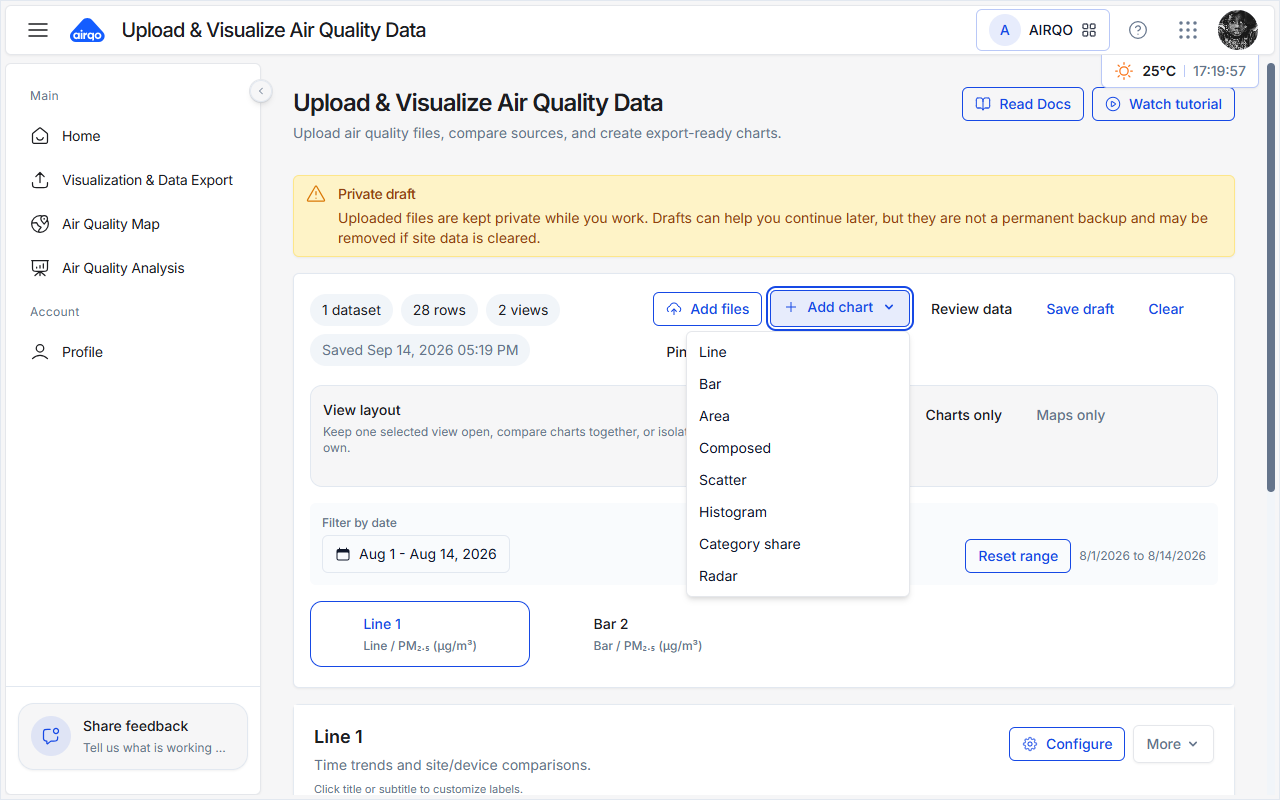
Chart Types
| Type | Best For |
|---|---|
| Line | Time trends and comparisons over time |
| Bar | Averages across sites, devices, or other groups |
| Area | Pollution load over time |
| Composed | Two measures on one time axis |
| Scatter | Correlation between two numeric fields |
| Histogram | Distribution of concentration values |
| Category share | Share by air quality band or group |
| Radar | Profile top groups across measures |
| Map | Geographic visualization (available when your dataset includes the required location data) |
Chart Cards
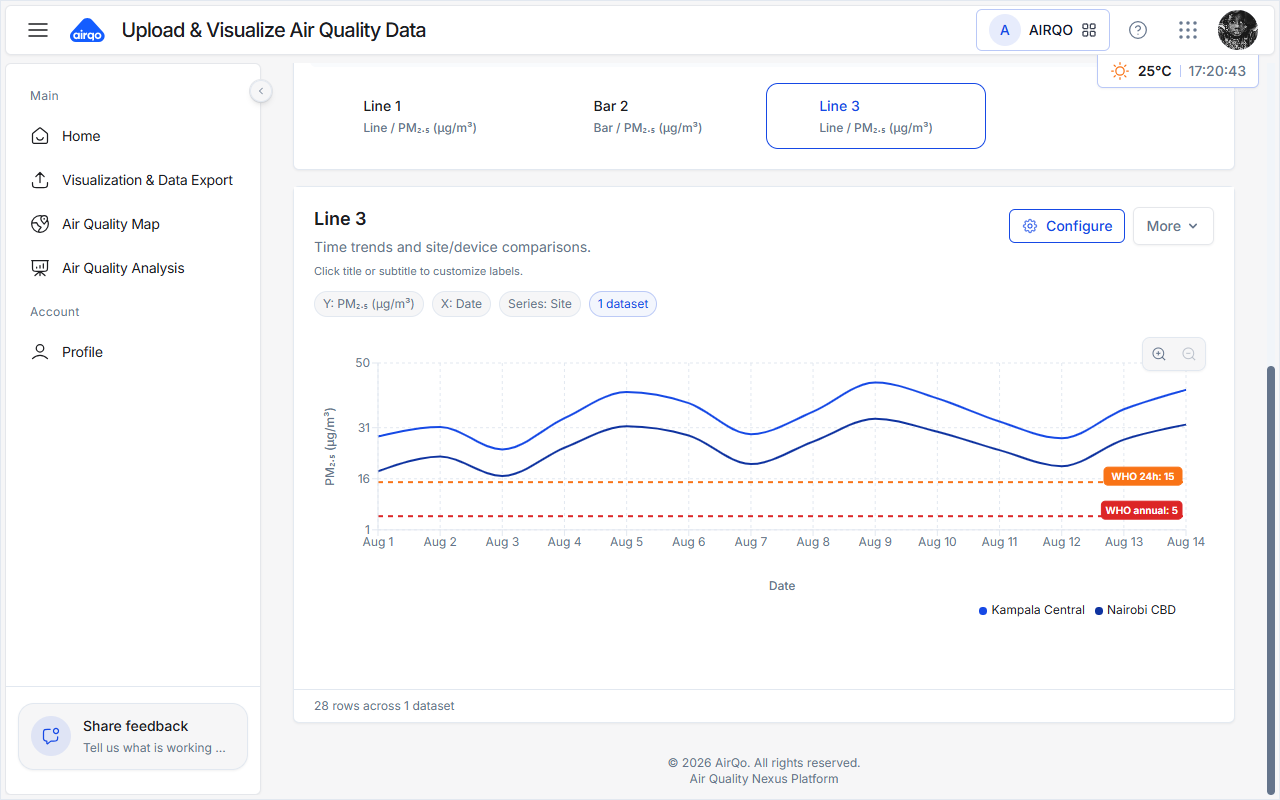
Each chart is shown as a card. From a chart card you can:
- Edit the title and subtitle inline
- Switch the chart type quickly
- Open the More (⋮) menu to export the chart as PNG or PDF
Filtering by Date
If your data contains a time column, a Filter by date control appears in the toolbar.
- Set a start and end date to focus on a specific period.
- All charts update in real time.
- Select Reset range to return to the full dataset period.
Display Modes
Use the display-mode buttons to control how charts are shown:
| Mode | Description |
|---|---|
| Selected view | Show only the active chart (focused mode) |
| Charts only | Show all non-map charts |
| Maps only | Show only map views |
| Compare all | Show all charts side by side |
Drafts and Saving
Your work is auto-saved as a private draft in your browser. This means:
- Closing the tab and returning later restores your datasets, charts, and configuration.
- A "Previous draft available" banner offers to Restore your last session.
- A "Private draft" banner clarifies that drafts stay on your device.
You can also select Save draft to save manually at any time, or Clear to reset the workspace and delete the saved draft.
Drafts are stored locally in your browser. They are not synced across devices or browsers, and they are private to you. Clearing browser data will remove saved drafts.
Exporting Charts
Each chart card's More (⋮) menu lets you export the chart:
| Export | Format |
|---|---|
| Export as PNG | .png |
| Export as PDF | .pdf |
Exported files are named automatically based on the chart title.
Limitations
| Limit | Value | Reason |
|---|---|---|
| Max file size | 100 MB per file | Browser memory constraints |
| Max imported rows | 50,000 per dataset | Keeps profiling and chart rendering responsive |
| Supported formats | .csv, .xlsx | Standard parsers |
Troubleshooting
| Issue | Possible Cause | Solution |
|---|---|---|
| Add chart shows toast | No data loaded yet | Upload a file first |
| No numeric columns detected | File has no measurement data | Ensure at least one column contains numeric values |
| Charts appear empty | Date range filter excludes all data | Select Reset range in the toolbar |
| Draft not restored | Browser storage was cleared | Re-upload your files |
Related Guides
- Export Air Quality Data — download platform data for offline analysis
- Air Quality Analysis — analyze trends and compare locations